We present a sensor-based location invariance momentum contrast for unsupervised visual representation learning in remote sensing application, where unlabeled data is well-known challenges to deep learning domain and accurate training data remains comparably scarce. In this study, we first introduce the use of SEN12MS datasets, a curated large-scale training data that include versatile remote sensing information from different sensors with global scene distributions. To continually bridge the gap between supervised and unsupervised learning on computer vision tasks in remote sensing applications, we exploit the geo-alignment data structure from SEN12MS to propose two training methods. One set is to construct sensor-based geo-alignment positive pairs in contrastive learning to design the natural augmentation. Another set is fusing data from different sensors with the objective of learning better representations. [last sentence subject to changes] Our experiments show that the proposed method outperforms the supervised learning counterpart when transferring to downstream tasks in scene classification for remote sensing data.
The performance of deep convolutional neural networks depends on their capability and the amount of training data. The datasets are becoming larger in every domain and different kinds of network architectures like VGG, GoogLeNet, ResNet, DenseNet, etc., increased network models' capacity.
However, the collection and annotation of large-scale datasets are time-consuming and expensive. Many self-supervised methods were proposed to learn visual features from large-scale unlabeled data without using any human annotations to avoid time-consuming and costly data annotations. Contrastive learning of visual representations has emerged as the front-runner for self-supervision and has demonstrated superior performance on downstream tasks. All contrastive learning frameworks involve maximizing agreement between positive image pairs relative to negative/different images via a contrastive loss function; this pretraining paradigm forces the model to learn good representations. These approaches typically differ in how they generate positive and negative image pairs from unlabeled data and how the data are sampled during pretraining.
Self-supervised approaches such as Momentum Contrast (MoCo) (He et al., 2019; Chen et al.,2020) can leverage unlabeled data to produce pre-trained models for subsequent fine-tuning on labeled data. In addition to MoCo, these include frameworks such as SimCLR (Chen et al., 2020) and PIRL (Misra and Maaten, 2020).
Remote sensing data has become broadly available at the petabyte scale, offering unprecedented visibility into natural and human activity across the Earth. In remote sensing, labeled data is usually scarce and hard to obtain. Due to the success of self-supervised learning methods, we explore their application to large-scale remote sensing datasets.
While most self-supervised image analysis techniques focus on natural imagery, remote sensing differs in several critical ways. Natural imagery often has one subject; remote sensing images contain numerous objects such as buildings, trees, roads, rivers, etc. Additionally, the important content changes unpredictably within just a few pixels or between images at the same location from different times. Multiple satellites capture images of the same locations on earth with a wide variety of resolutions, spectral bands (channels), and revisit rates, such that any specific problem can require a different combination of sensor inputs(Reiche et al., 2018,Rustowicz et al., 2019).
While MoCo and other contrastive learning methods have demonstrated promising results on natural image classification tasks, their application to remote sensing applications has been limited.
Traditional contrative learning utilizes augmentation to generate positive pair. Inspired by recent success (Geo-aware Paper) using natural augmentation to create positive pairs, we propose to use positive pairs from different sensors for the same location.
In this work, we demonstrate that pre-training MoCo-v2 on data from multiple sensors lead to improved representations for remote sensing applications.

Many self-supervised learning methods for visual feature learning have been developed without using any human-annotated labels. Compared to supervised learning methods which require a data pair Xi and Yi while Yi is annotated by human labors, self-supervised learning also trained with data Xi along with its pseudo label Pi while Pi is automatically generated for a pre-defined pretext task without involving any human annotation. The pseudo label Pi can be generated by using attributes of images or videos such as the context of images or by traditional hand-designed methods. As long as the pseudo labels P are automatically generated without involving human annotations, then the methods belong to self-supervised learning. Recently, self-supervised learning methods have achieved great progress.
Self-supervised contrastive learning approaches such as MoCo , MoCo-v2, SimCLR, and PIRL have demonstrated superior performance and have emerged as the fore-runner on various downstream tasks. The intuition behind these methods are to learn representations by pulling positive image pairs from the same instance closer in latent space while pushing negative pairs from difference instances further away. These methods, on the other hand, differ in the type of contrastive loss, generation of positive and negative pairs, and sampling method.
Contrastive learning of visual representations using MoCo (MoCo-v2 - Chen, et al., Facebook AI Research, 2020) has emerged as the front-runner for self-supervision and has demonstrated superior performance on downstream tasks.
There is a performance gap between supervised learning using labels and self-supervised contrastive learning method, MoCo-v2, on remote sensing datasets. For instance, on the Functional Map of the World (fMoW) image classification benchmark, there is an 8% gap in top 1 accuracy between supervised and self-supervised methods. By leveraging spatially aligned images over time to construct temporal positive pairs in contrastive learning and geo-location in the design of pre-text tasks, Geography-Aware Self-supervised Learning (Ayush, et al., Stanford University, 2020) were able to close the gap between self-supervised and supervised learning on image classification, object detection and semantic segmentation on remote sensing and other geo-tagged image datasets.
In this work, we provide an effective approach for improving representation learning using data from different satellite imagery using MoCo-v2.
Does contrastive pre-training with data from multiple sensors lead to improved representations for remote sensing applications?
Pre-train the contrastive model using unlabeled data from multiple satellites and use that model for downstream remote sensing tasks.
We want to show that our approach to using images from different satellites for the same location as naturally augmented images as input to the MoCo-v2 method provides high-quality representations and transferable initializations for satellite imagery interpretation. Despite many differences in the data and task properties between natural image classification and satellite imagery interpretation, we want to show the benefit of MoCo-v2 pretraining across multiple patches from different satellites for satellite imagery and investigate representation transfer to a target dataset.
- [todo] keep only sen12ms.
To validate our ideas, we did experiments on datasets with different satellite imageries with variations in dataset size, channels, and image ground resolutions. The statistics of these datasets are given below. Readers are requested to see the the supplementary materials for examples and additional details of these datasets.
| Dataset | Satellites | Number of Images | Image Size | Labels | Notes |
|---|---|---|---|---|---|
| BigEarthNet | Sentinel-2A/B | 590,326 patches; 12 Bands | 20x20 to 120x120 | Multiple, 43 Full and 19 Simplified | No overlapping; 10 European Countries |
| SEN12MS | Sentinel-1A/B; Sentinel-2A/B; MODIS (Terra and Aqua) | 541,986 patches; 180662 triplets (3*180662); 4, 2 and 13 Bands | 256X256 | Single, 17 Full and 10 Simplified | Partial overlapping |
| FMoW | QuickBird-2; GeoEye-1; WorldView-2; WorldView-3 | 1,047,691 patches; 4, 8 and RGB Bands | Variable Over 2500x2500 | Multiple, up to 63; Bounding Box Annotations | Includes False Detection; Variable timestamp overlapping |
The SEN12MS dataset contains 180,662 patch triplets of corresponding Sentinel-1 dual-pol SAR data, Sentinel-2 multi-spectral images, and MODIS-derived land cover maps. The patches are distributed across the land masses of the Earth and spread over all four meteorological seasons. This is reflected by the dataset structure. The captured scenes were tiled into patches of 256 X 256 pixels in size and implemented a stride of 128 pixels, resulting in an overlap between adjacent patches. Only 3847 patches do not have any overlap with adjacent patches. Most of the overlap occurs around 25% and 50% of the area with few patches overlapping less than 15% and more than 75%.
All patches are provided in the form of 16-bit GeoTiffs containing the following specific information:
- Sentinel-1 SAR: 2 channels corresponding to sigma nought backscatter values in dB scale for VV and VH polarization.
- Sentinel-2 Multi-Spectral: 13 channels corresponding to the 13 spectral bands (B1, B2, B3, B4, B5, B6, B7, B8, B8a, B9, B10, B11, B12).
- MODIS Land Cover: 4 channels corresponding to IGBP, LCCS Land Cover, LCCS Land Use, and LCCS Surface Hydrology layers.
(TODO for Ernesto) should discuss dataset split for training and test (holdout set)
- 32K set
- potential issue with full set
- test set
- 1K set
In this section, we briefly review Contrastive Learning Framework for unsupervised learning and detail our proposed approach to improve Moco-v2, a recent contrastive learning framework, on satellite imagery from multiple sensors data.
Multiple-Sensor Update on different bands, different satellites etc. with images.
Contrastive methods attempt to learn a mapping fq from raw pixels to semantically meaningful representations z in an unsupervised way. The training objective encourages representations corresponding to pairs of images that are known a priori to be semantically similar (positive pairs) to be closer to each other than typical unrelated pairs (negative pairs). With similarity measured by dot product, recent approaches in contrastive learning differ in the type of contrastive loss and generation of positive and negative pairs. In this work, we focus on the state-of-the-art contrastive learning framework MoCo-v2, an improved version of MoCo, and study improved methods for the construction of positive and negative pairs tailored to remote sensing applications.
Given the SEN12MS that provides the largest remote sensing dataset available with its global scene distribution and the wealth of versatile remote sensing information, It is natural to leverage the geo-alignment imagery from different remote sensing sensors while constructing positive or negative pairs . For example, Sentinel 1 consists of two images (vertical and horizontal polarization) and Sentinel 2 consist of thirteen images (different wavelength bands) of the same patch. Any combination from the same patch would correspond to a positive pair without the need of additional augmentation, while negative pairs would correspond to any image from different patches without restriction of the same or different satellites.
In short, given an image x_i(s1) collected from sentinel 1, we can randomly select another image x_i(s2) collected from sentinel 2 that is geographically aligned with the x_i(s1), and then have them passthrough MoCo-v2 to the geographically aligned image pair x_i(s1) and x_i(s2), which provides us with a sensor-based geo-alignment positive pair ( v and v’ in Figure xxx) that can be used for training the contrastive learning framework by the query and key encoders in MoCo-v2.
For a sample of x_i(s1), our GeoSensorInforNCE objective loss can be demonstrated as follows:
INSERT FIGURE HERE (GeoSensorInfoNCE)
where z_i(s1) and z_i(s2) are the encoded representation of the randomly geo-aligned positive pair x_i(s1) and x_i(s2). N denotes the number of negative samples, {k_j}j=1_n are the encoded negative pairs, and \lambda is the temperature hyperparameter.
What we used are the actual images from the same location but different sensors. With the inspiration of the success of geography-aware self-supvervised learing (insert ref -- geo xxxxx paper )that constructs temporal pairs from real images, we also rely on the assumptions that the actual images for positive pairs encourages the entire network to learn better representations for real sensors data than the one focusing on augmentation strategies and synthetic images. xxxxx
Instead of the first approach, we data fusioned sentinel 1 (2 bands) and sentinel 2 images (10 bands) together with the same locations and apply a set of combinations of images including sentinel 1 and sentinel 2 together, sentinel 2 only, and sentinel 1 only to construct one fusioned image. In a sense that we build a straightforward constraving learning directly under MoCo v2.
From the above perspective of the training methods in contrastive learning, including naturally augmented positive and negative pairs and the data fusion approach, we noticed that the volume (bands) of the inputs from different sensors are different. In order to match the typical dimensions of the image channels, our study also applies the Network in Network concept (Min Lin et al)(insert ref --NIN) to the sourced images in the sensor-based geo-aligment pairs scheme, as well as the data fusioned image in our second set of experiments. As such, we introduced an extra layer of one by one convolution filter block to perform cross channel sampling, thereby matching and aligning the depth of the channels from different sensor images while introducing non-linearity before the MoCo v2 encoding. With the implementation, we leverage this trick to carry out a pretty non-trivial computation on the input volume whereas we hope to increase the generalization capability in the network.
Pre-training is performed twice for comparison proposes. First, examples from all patches are included (180,662). Second, pre-train includes a sample of the dataset which patches do not overlap with their adjacent patches. This sample of the dataset is selected on firs come first serve basis and any adjacent overlapping patch is ignored. The selection consist of 35,792 patches.
The model is pre-trained on different scenarios to compare the performance of the model. First, the model is trained by using the original approach of MoCo V2. The input image is augmented by gaussian blur, elastic transformation, vertical and horizontal flip. Second, the model with the approach proposed in this work that is using images from different satellites as positive pairs. Third, in order to generalize the model, augmentation is applied to both satellites during training. The pre-train is also done with both the complete dataset and the non-overlapping sample described in the previous section.
The encoders have ResNet50 architecture (50 layers deep, 2048 nodes) with 128 output nodes.
These encoders are designed for a RGB input (3 bands) and Sen12MS data set is 2, 4 and 13 bands for S1, LC and S2 respectively.
To overcome this structure constrain, a convolutional layer is included before the encoders to map the input with different bands to 3.
The weights of this layer are not updated during training.
The momentum constant (m) is 0.9 and the learning rate is 0.03. The temperature factor for the loss function is 0.2. The batch size is 64.
We compared supervised learning with HPT model
- SEN12MS - Scene Classification
- Supervised Learning Benchmark vs HPT model
**Implementation Details **
- downloaded pretrained models from t
- the original IGBP land cover scheme has 17 classes.
- the simplified version of IGBP classes has 10 classes, which derived and consolidated from the original 17 classes.
Qualitative Analyis
- Supervised training (full dataset)
- baseline: downloaded the pre-trained the models and evaluate without finetuning.
- Supervised training (1k dataset)
- Supervised: original ResNet50 used by Sen12ms
- Supervised_1x1: adding conv1x1 block to the ResNet50 used by Sen12ms
- Finetune/transfer learning (1k dataset)
- Moco: the ResNet50 used by Sen12ms is initialized with the weight from Moco backbone
- Moco_1x1: adding conv1x1 block to the ResNet50 used by Sen12ms and both input module and ResNet50 layers are initialized with the weight from Moco
- Moco_1x1Rnd: adding conv1x1 block to the ResNet50 used by Sen12ms. ResNet50 layers are initialized with the weight from Moco but input module is initialized with random weights
- Finetune v2 (1k dataset)
- freezing ResNet50 fully or partially does not seem to help with accuracy. We will continue explore and share the results once we are sure there is no issue with implementation.
other findings:
- ResNet50_1x1 (s2) 100 epoch and 500 epoch shows similar accuracy. (especially for multi-label).
- ResNet50_1x1 (s2) shows significantly better result with 0.001 than 0.00001 (both single label and multi-label)
(findings pending verifications)
- By looking at the results between models with 1x1 conv and without 1x1 conv counterparts, almost all models with 1x1 conv block underperform the ones without 1x1 conv block. It appears that adding 1x1 conv layer as a volumn filters may loss some bands information overall with the finetune evalutions.
Our sensor-based geo-alignment postive pair approach took sentinel 2 images with 10 bands and sentinel 1 images with 2 bands with the same locations, and had them pass through a convolution 1x1 block before the MoCo v2 framework. Thereafter each of the images outputted a generalizable 3 channels wide images from sentinel 2 and sentinel 1 separately for us to construct the query and key encoder under MoCo v2.
The evaluations utilizing SEN12MS sense classification pipeline. Overall, multi-label accuracy resulted better than single-label accuracy across supervised and MoCo models. In general, due to the label noise for the SEN12MS dataset, the highest accuracy we could get may introduce irreducible errors. Knowing the provided supervised pre-train models on the full dataset does not contain s1-only data, In order to bring comparisons with the provided supervised model (full dataset) to our approach, our finetune started with 1k dataset and applied both supervised models and MoCo models with s2 dataset as well as s1/s2 dataset. In addition, we applied different finetune strategies with or without introducing the 1x1 conv block outputted weights from MoCo.
As a result of the finetune/ transfer learning, introducing 1x1 convolution weight from MoCo underperforms the ones without 1x1 convolution block, it appears models adding 1x1 convolution block from MoCo may distort the finetune evaluations, suggesting the representation of the learning may not be optimal. We continue to explore transfer learning using either the simplified dataset and evaluations, or the dataset that has less label noises.
aug set 1: resizecrop aug set 2: resizecrop, blur aug set 3: aug set 2 + color jittering/ grayscale (optional for now)
- all fusion: s1/s2 stacked image are augmented and used as q, k.
- partial fusion: s1, s2, s1/s2 image are equally mixed in the train dataset
scence classification (multi-label)
?Quesiont/Discussion -- (1) should we bring dp place down, or perhaps transform to % number? as other paper like moco, moco v2, simclr all show more succinet number format in terms of the acc results. and it looks more clear. (2) should we temporarily choose the best resuls for each of the dataset. moco has a randomly sample mechencism unless we further details and fintune with different paramters. but now, would it be goood if showcase our results that we are in the promising direction (and for presenation). we definilty need to visit back for this part tho.
aug set 1(TBD)
| aug set 1 | s1 | s2 | s1/s2 | Note |
|---|---|---|---|---|
| Supervised (full) | xx | xx | xx | xx |
| Supervised (1024) | xx | xx | xx | xx |
| --- | --- | --- | --- | --- |
| [sensor-based augmentation] | xx | xx | xx | xx |
| [all fusion] | xx | xx | xx | xx |
| [partial fusion] | xx | xx | xx | xx |
| [optional fusion] | xx | xx | xx | xx |
aug set 2
| aug set 2 | s1 | s2 | s1/s2 | Note |
|---|---|---|---|---|
| Supervised (full) | Pretrained model is not provided | .60 | .64 | need to retest s1, s2 with zero padding |
| Supervised (1024) | 0.4003 | 0.6108 | .5856 | |
| --- | --- | --- | --- | --- |
| [sensor-based augmentation] | - | 0.6277 | 0.6697 | xx |
| all fusion | xx | [.6251]? | .5957 | |
| partial fusion | .4729 | .5812 | .6072 | |
| optional fusion | .4824 | .5601 | .5884 |
- Supervised (full) s1, s2 need to be retested with zero padding 12 channel.
We perform transfer learning experiments with our two proposed methods on land cover scene classification across xx label class using SEN12MS dataset to understand the quality of the learned representations. Given that the image samples are randomly sampled to positive and negative pairs in MoCo v2 to compute the loss during training processes, we have finetune with different hyper-parameters and selected the best results on each of the evaluation dataset in our reporting.
Using the pre-trained with our sensor-based geo-aligned pairs approach, our finetune on the 1,024 samples for the multi class classification shows that the performance on s1 and s2 data together has better performance than the supervised model with the same size of samples. Due to our learned representation being constructed by encoders from two sensor images data with multiple bands information, we argue that the downstream results would perform better on the dataset including both s1 and s2 data, as it appears in the results.
Whereas by looking at the evaluation results with our geo-alignment data fusion approach on 1,024 samples, as shown in the table, we can see that
-
(1) In general, the downstream multi-class accuracy of our data fusion on moco framework results in better performance of the supervised counterparts applying on s1 and s2 data together. Similar to our first approach result, as our learned representation for the data fusion is on sets of combinations of s1 and s2 data, the downstream results perform better on the dataset including s1 and s2 data.
-
(2) The results of the optional fusion approach also perform slightly less accuracy than the full fusion and partial fusion strategy across the combination of the evaluation dataset.
-
(3) By only looking at the pre-trained model. The evaluation on both s1 and s2’s performance shows better accuracy compared to s1 or s2 alone. This is inline with our expectations.
scence classification (multi or single label?)
aug set 1(TBD)
| aug set 1 | s1 | s2 | s1/s2 | Note |
|---|---|---|---|---|
| Supervised (full) | xx | xx | xx | xx |
| Supervised (1024) | xx | xx | xx | xx |
| --- | --- | --- | --- | --- |
| [sensor-based augmentation] | xx | xx | xx | xx |
| [all fusion] | xx | xx | xx | xx |
| [partial fusion] | xx | xx | xx | xx |
| [optional fusion] | xx | xx | xx | xx |
aug set 2
| aug set 2 | s1 | s2 | s1/s2 | Note |
|---|---|---|---|---|
| Supervised (full) | xx | xx | xx | xx |
| Supervised (1024) | .4008 | .5496 | .5423 | xx |
| --- | --- | --- | --- | --- |
| [sensor-based augmentation] | xx | xx | xx | xx |
| [all fusion] | xx | xx | xx | xx |
| [partial fusion] | .4279 | .5351 | .5352 | xx |
| [optional fusion] | .4478 | .5120 | .5294 | xx |
- Supervised (full) s1, s2 need to be retested with zero padding 12 channel.
(similiar to below charts, we don't have time/ train differet batch and epochs, but if we could provide simpler example just to show we are seeting the trends could be good to inline with other papers)
 (perhaps we could include 32, 64 batch, and 100, 200 epochs similart to this)

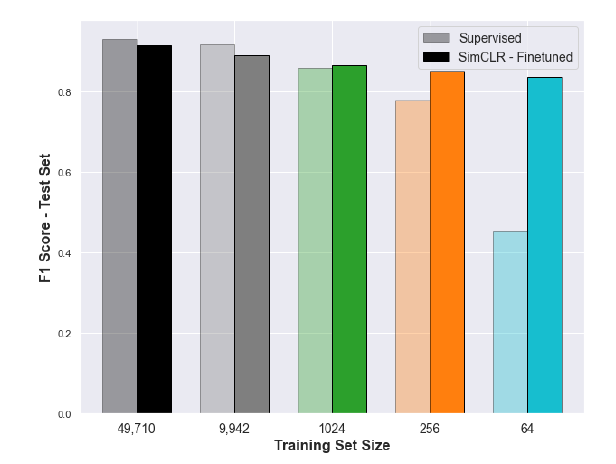
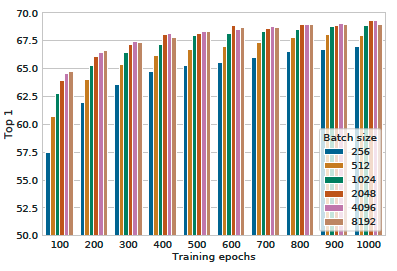
Table xx shows the impact of batch size when models are trained and evaluated on. When training epochs is small(100, 200), larger batch sizes have a significant advantage over the smaller ones. [Having more training epochs, we also shows that the gaps would decrease between different batch size]. As such, our pre-trained approach on the MoCo v2 contrastive learning framework in remote sensing imagery helps stabilize the model performance as a function of labeled data set size, compared to supervised model across the same size of data.
xxx
TODO: Use APA style later. Do this once the draft is ready by taking the links in the document, giving them a number and use APA style generator.
[1]
[2]
[3]
[4]
[5]
(1) [placeholder] to rationale the multi or single label transfer learning** (tmp) multi-label classification results is more appropratie to evaluate the transfer learning in our scene classfication satelitle imagery, becasue xxx
(2) more detailed table results if needed xxx
(3) xxx