EC 463: Senor Design Mini Project Report
By: Steven Wang & Yu-Sheng Chen
Explanation:
Our hardware mini project is based on the wifi module on raspberry pi; the goal is to collect data on electronic devices within 20 meters radius including cars with hotspot activity. We were able to get both wifi_scan.py and bluetooth files to work using bt_scan.py & ble_scan.py on our Raspberry pi.
We set up our test in the Photonics building room pho 111 adjacent to the windows where there are cars coming on both dividers as well as the bridge above, next to photonics. The change we made to the wifi_scan.py stem around the float parameter to measure and collect 4 criteria when it scans for nearby electronic devices. After scanning for 30 mins we then parse the information into a json file for analysis and compile a graph of the wifi module detection over the period of time when it's actively looking for wifi. We expected fluctuation around cars from moving in between the roads and attempting to find new unique devices.
Discussion:
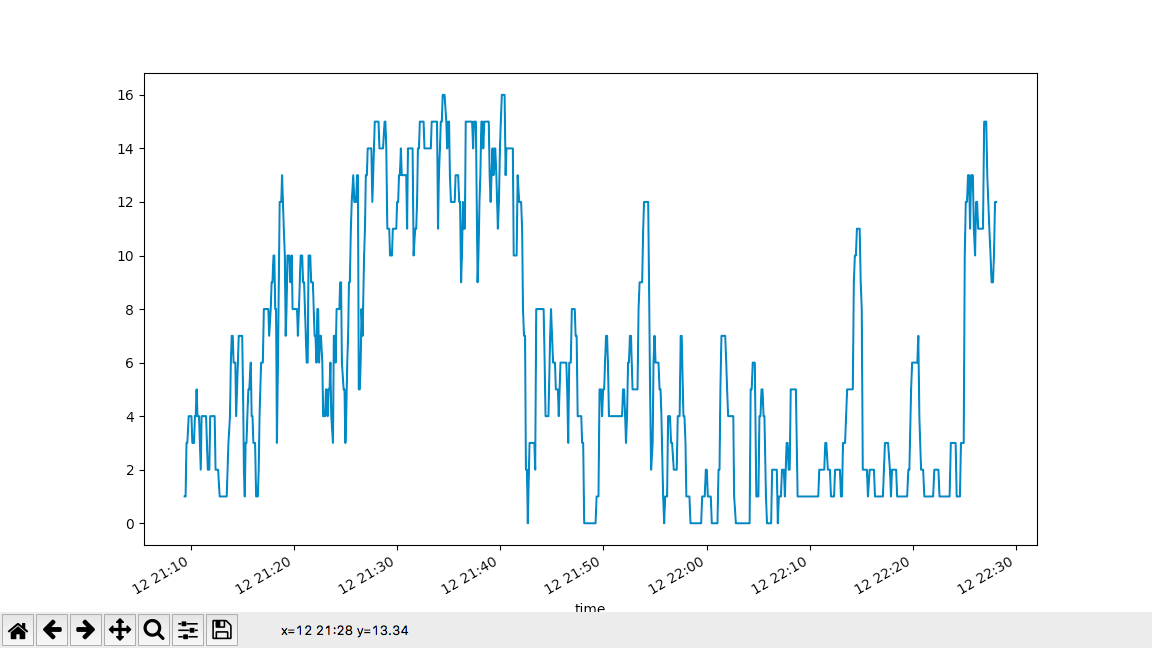
These are the 4 graphs we acquired based on the different period of time the unknown devices were detected to be stationary.
The first graph used the default value, 0.5.
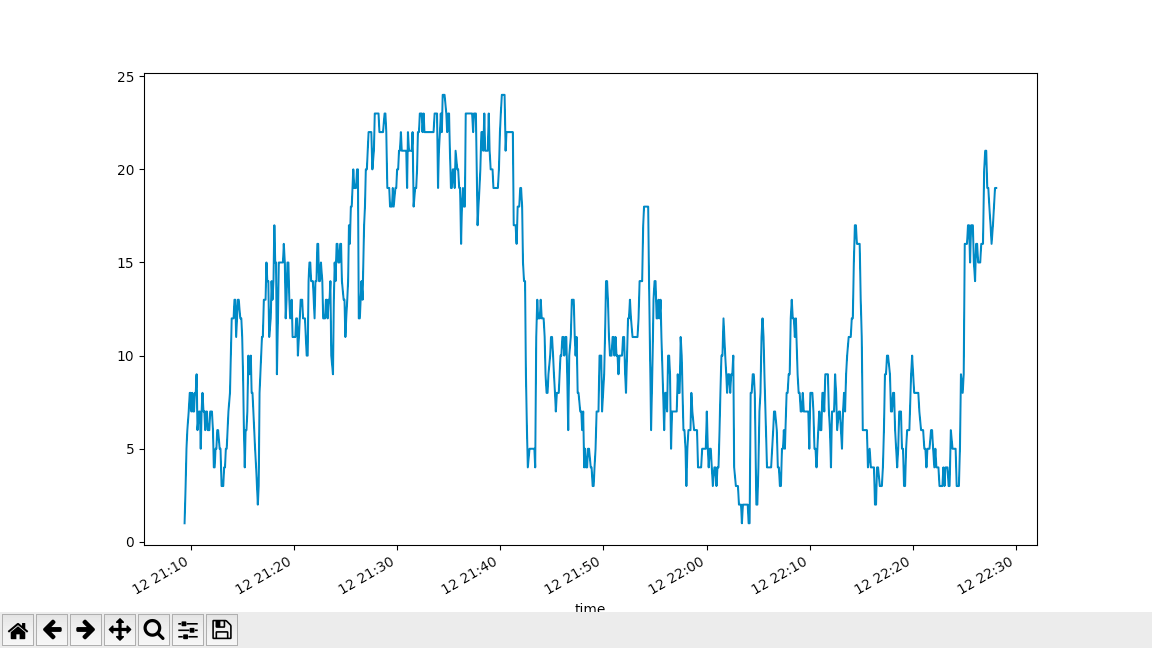
 The second graph used 0.75
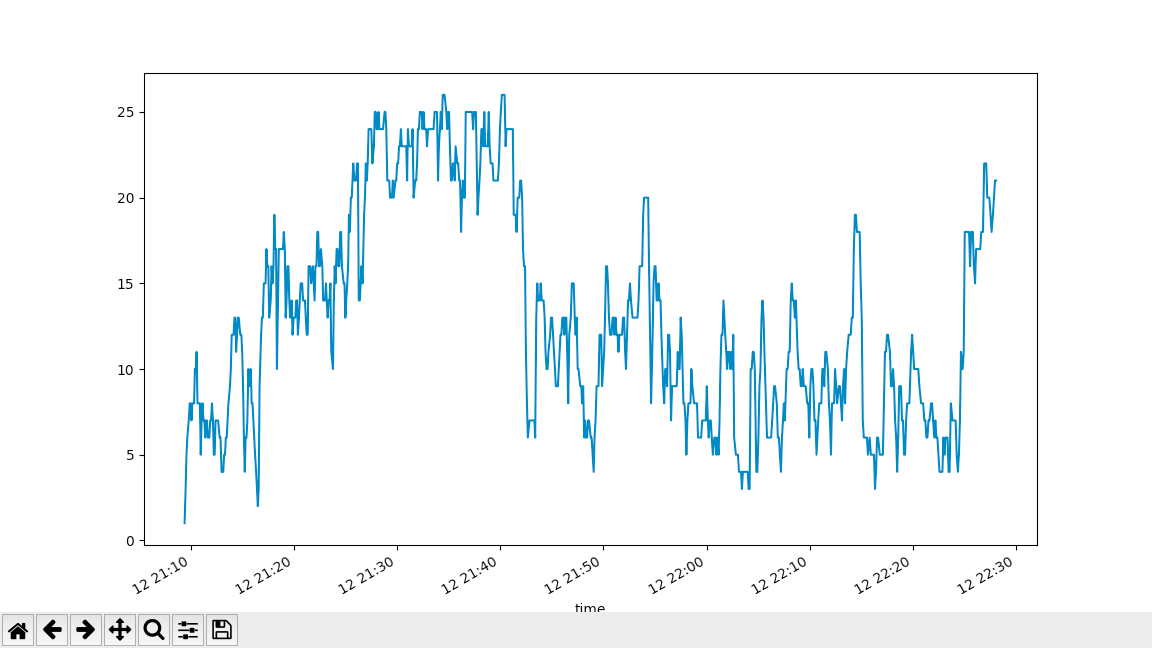
 The third graph used 0.9
 The fourth graph used 0.25
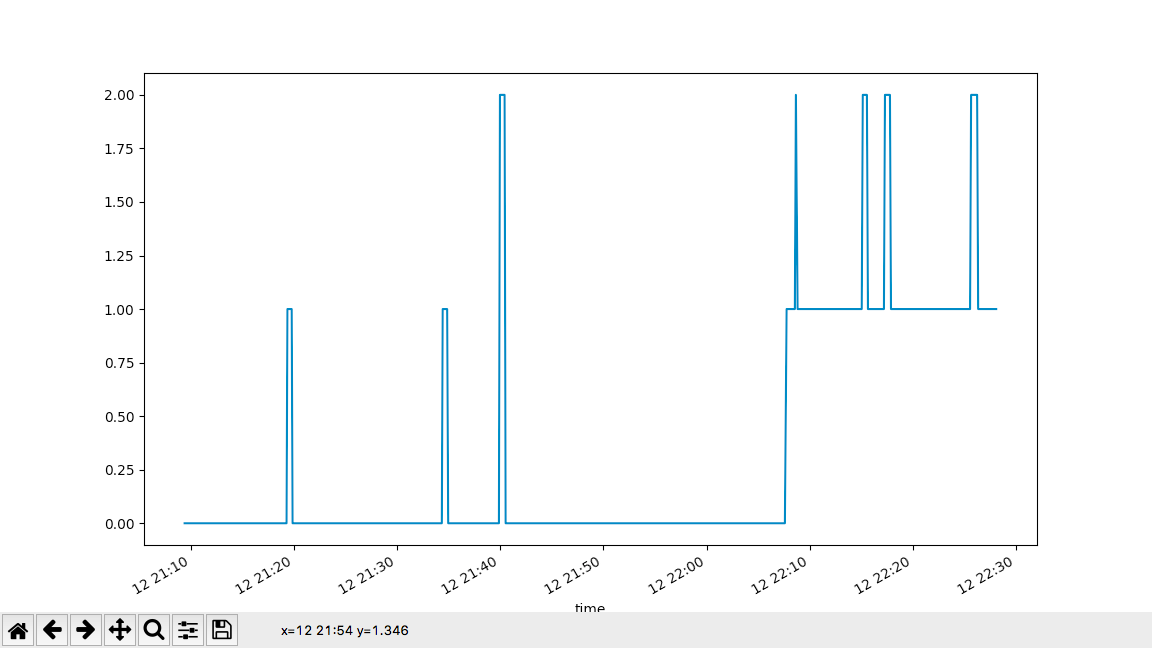
Based on the graph we can see how many wifi activity were detected during that time, with respect to the number of cars with hotspot adjacent to the lab.
From graph 2 and 3, we can see that the graph looks the same, and can be concluded that the changes on the float parameter will not change the results. Furthermore, from graph 1 and 2, we can see that the trend seems simliar but the amount of cars detected at each period of time from graph 2 are larger. This is because that the 0.75 is more wider condition. Last, comparing between graph 4 and 1. We can conclude that 0.25 is a very stricted condition, where the amounts of car detected is lesser than car detected using 0.5 float value. From our perspective, I beleive that using smaller parameter seems more accurate and efficent to perdict the actual result, since the graphs are similar after comparing different float values.
Difficulties:
As our first time using raspberry pi, the overall experience went well. We found that raspberry pi could be used as a small computer that is similar to our desktop and Mac. There are two major difficulties that we faced while we are working with the raspberry pi. The first difficulites we encouter was setting up the SSH after installing the Raspberry Pi OS onto the micro sd card, we wanted to establish a wired / wireless connection betwenn Raspberry Pi with our Macbooks. We. attempted to make SSH connection by just entering commands in the IOS terminal, however it doesn't work. It turned out Raspberry Pi wasnt friendly toward IOS platform some actions cant be turned on manually compared to the Windows counterpart. Then we tried to connect Raspberry Pi to an external monitor using hdmi cables to project Raspberry Pi interface which works fine. The second difficulties that we faced is running the wifi_plot.py. There are many commands we needed to setup before running the script. At first we try to setup using "sudo apt install python3-numpy", however it gives an error, so we try "python3 -m pip install numpy xarray matplotlib" and it worked! There was an information gap we learned from this experience, some commands werent distinguish between OS type and versions.