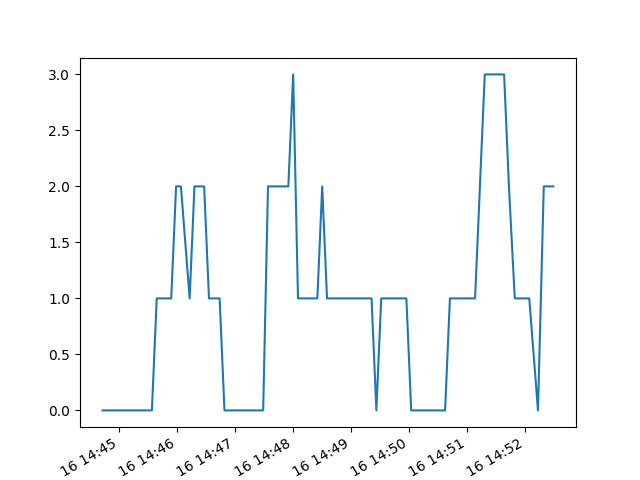
Explanation: The data we collected is from the senior design lab near the window around 3pm on Thursday. Data was collected for about 20 minutes, and yeilded 3 data file scans.
Difficulties: We first had trouble in the beginning stages because we didn't know that we had to close out of the python interpreter after the python setup. We had to use a personal hotspot in the lab because we were unable to connect to any of the BU wifis. We also didn't know how to ensure that the raspberry pi was connected to our laptops, until we found a command that secures the connection. (ping raspberrypi.local) When it was time to copy the JSON file to our laptop, we were given trouble using SCP. First, in order to do this type of transfer, a ssh connection had to be made on both the raspberry pi and the windows laptop we were using. In order to establish ssh on a windows OS, we had to download a software called PuTTY. This seemed promising at first, but we were constantly getting a new error that stated "ssh could not resolve hostname. Name or service not known lost connection." So instead, we signed into github on the raspberry pi and uploaded the json files to there so that we may access them from our laptops. Then, in the wifi_plot.py file we had to change the MAX_SSID from 100 to 200 because when we ran it on our laptops with the max as 100, we were given an index error.
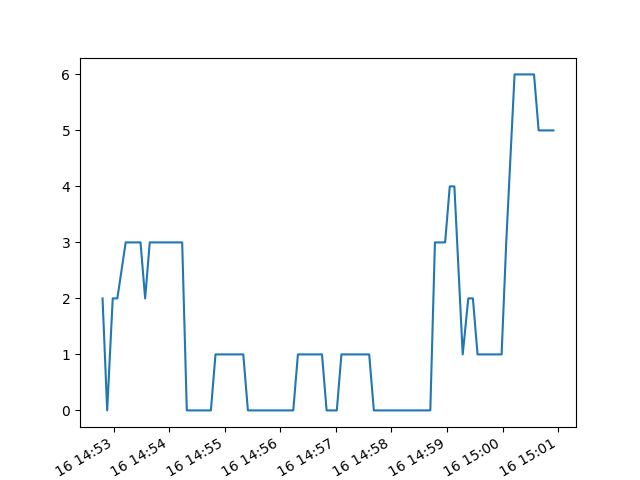
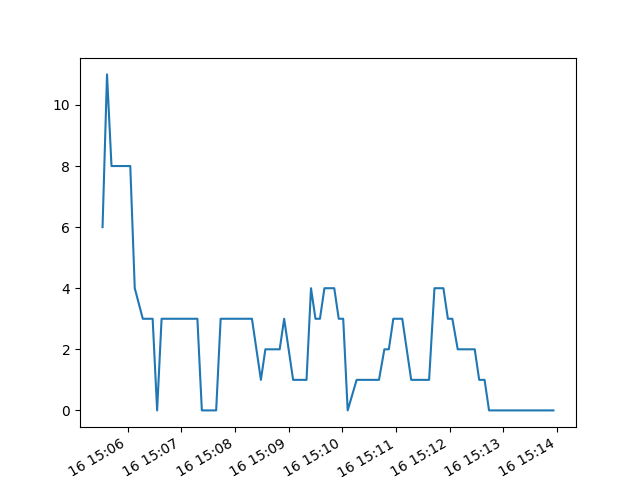
Discussion: Overall, there is an apparent volatility in the number of active devices on the network, suggesting a lot of moving traffic in the general vicinity. A quick jump in the scan would likely be caused by a group of students going to class or congregating in a common area. At around 15:00 there is a large incline to 10 devices (through scans 1 and 2), which is around the time that a block of classes is starting further supporting our speculation.