Team 13: Wenjun Ma and Man Hang Henry Chong
Our team goal is to utilize the wifi_scan.py function which accomplished by Raspberry Pi to detect the number of nearby moving or static hotspot. The goal is easily achieved when we use wifi_scan.py to scan and log the data to a specific file which would be transfered into our laptops to be further interpret by wifi_plot.py.
First, we setup the Raspberry Pi hardware and operating system Raspberry Pi OS and get familiarity with Python and embedded sensors using the Raspberry Pi OS. Finally, collect and plot data using the Raspberry Pi as a wireless sensor. We examine the possibility of detecting automobile and fixed wifi in an area. Since the place where we conducted the scanning is in PHO 111 where near a driveway, we focused our efforts more on interpreting the impact of automobile on the number of wifi detected. While more precise tracking requires multiple radio receivers, just using one receiver in our Raspberry Pi can give a sense of automobile activity in an area. We have conducted two wifi scanning and both of them have different results.
Explanation:
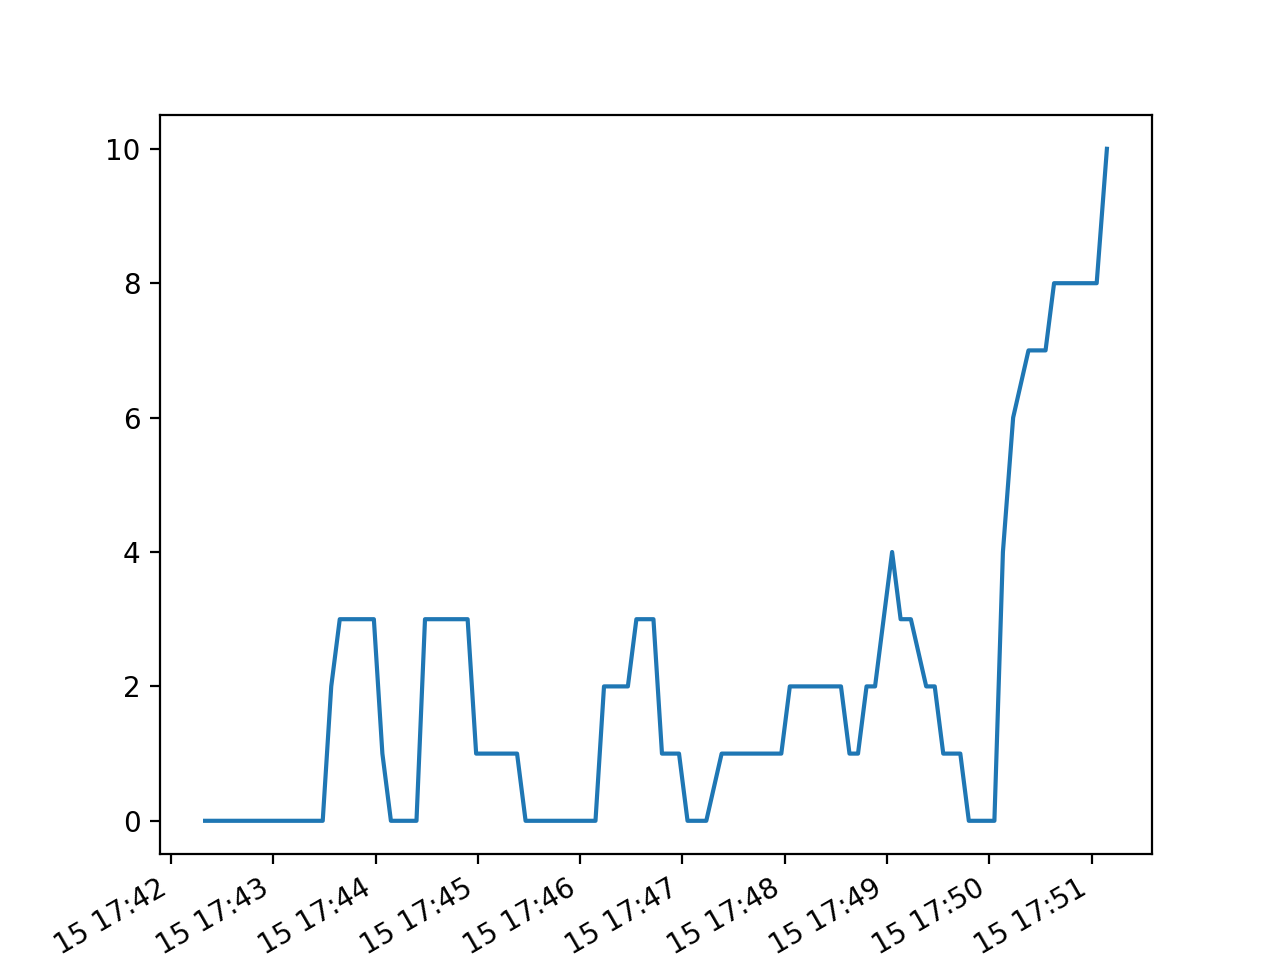
The first wifi scanning is conducted in PHO111 where is located near a drive way. As we could see in the graph, in the most of the time, the number of wifi detected during the scanning is 3. This result makes sense since there are 3 fixed university wifi which can always be detected in PHO 111. Furthermore, the number of wifi detected in the last minute is becoming more and more which also make sense since at that time, the number of cars past by is relatively high.
Discussion:
The first plot drawn by wifi_plot.py shows a lot of 0 wifi detected among the 100 times of scans, especially in the beginning 2 minutes of the scanning. However, since the scanning is done in PHO 113, which means that even there are no other hotspots moving by, it should at least shows 3 detected wifi which are the univerisity networks. When we were reviewing the process of scanning in terminal, we found that there are several times of error saying that the device . This may be the only reason why we got several 0 wifi detected output from the program.
Explanation:
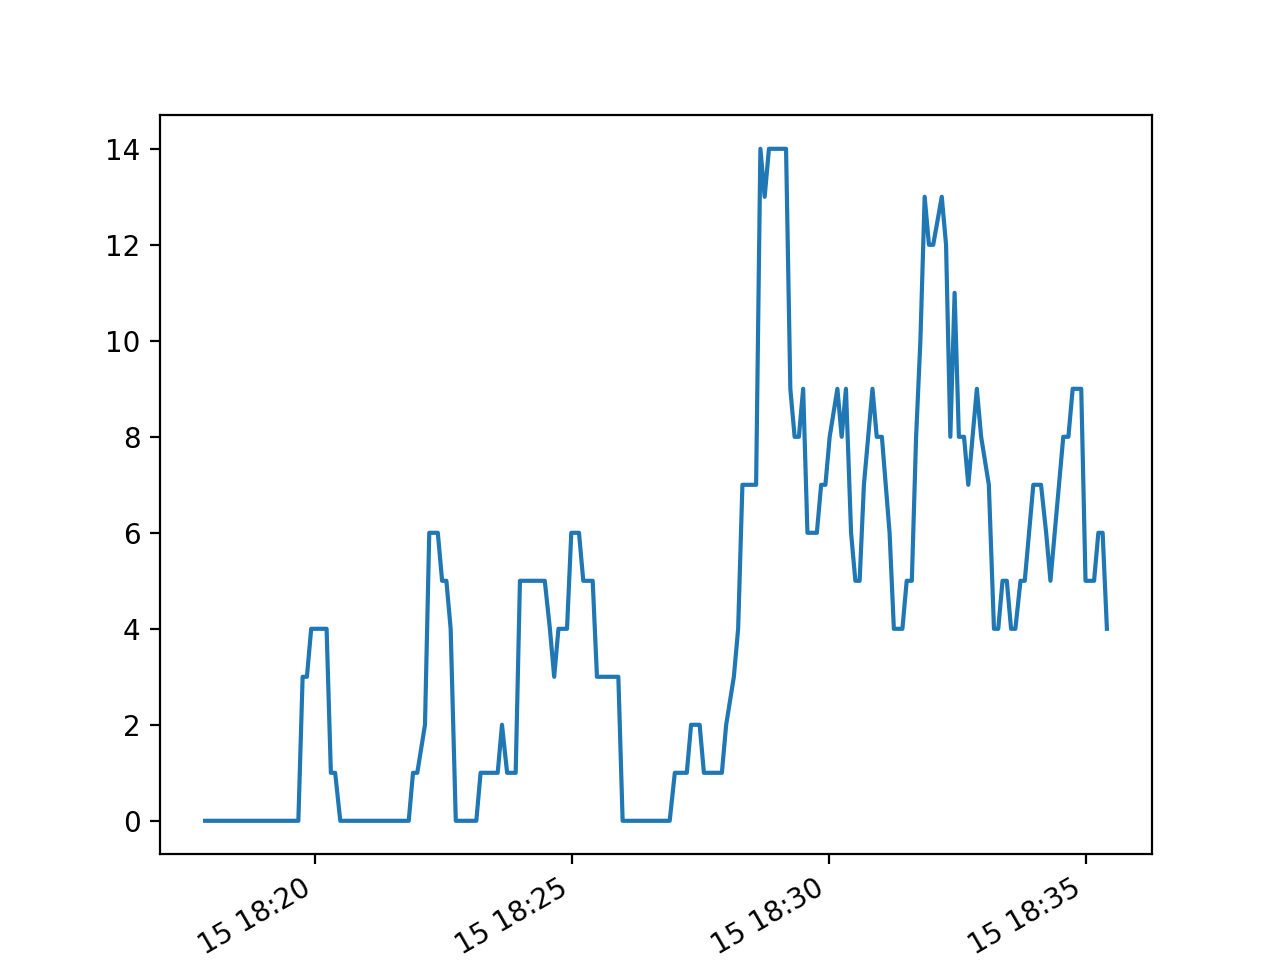
The second wifi scanning is tested in the same area as the first wifi scanning near a drive way. Unlike the first wifi scanning, this second one is scanned for 200 times. By comparing the first graph and second graph, the graph has a significant increase in the amount of wifi detected. This result makes sense as the second wifi scanning has done for a longer period and was conducted during the after-work hours. We believe the longer of the wifi scan, the more devices will be detected.
Discussion:
The second plot shown by wifi_plot.py indicates that there are 4 to 5 wifi detected in average during the first 15 minutes, while 10 to 13 wifi detected during the last 15 minutes. We can not ensure why there was a huge difference between this two period of time. It could be because the number of cars or personal hotspots were detected around the time.We are glad that we did the second wifi scanning to show a difference between the first and second plot.
The major difficulties we had during the mini-project is knowing how to transfer the JSON file we created to our laptops. Since we both have macbooks, which do not create a network to share under the security & safety issues, but the things solved after we decide just to use university wifi. Overall, the whole mini-project is smooth and straight-forward.