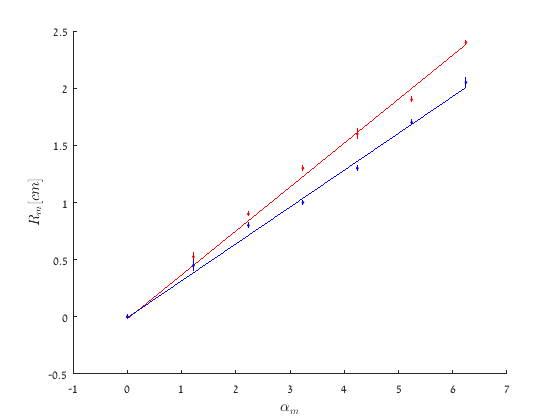
Many times we are required to plot similar data sets (and their fits) together, similar to plot overlay. For example, the relation between voltage and current at different temperatures. We imagine loading many data sets, plotting them + any number of fitted function. An example of the desired output is attached in the screenshot: two different data sets, with different fits, are displayed together.
Many times we are required to plot similar data sets (and their fits) together, similar to plot overlay. For example, the relation between voltage and current at different temperatures. We imagine loading many data sets, plotting them + any number of fitted function. An example of the desired output is attached in the screenshot: two different data sets, with different fits, are displayed together.
