Examine alignment results #15
-
|
Hello there, we've been extensiveley using your tool on our dataset. It is very helpful! Now we're trying to examine the results. Best indicator for now is looking manually at the deformation fields, which show us the areas where the image has been transformed. Irregularities at the "grid" show us deformations of the area, whereas the color and brightness indicate the direction of the displacement and its' magnitude according to the repositories' readme. Are there any further informations on the color code? How are they mapped to the direction? I'm also interested in evaluating the data summary, but I'm not quite sure how to interprete these values. Is there any way to calculate, whether images had to be warped intensively or not? We only want to keep those image datasets, where the alignment didn't need to alter the original images too much. I'm looking forward to some insights and pleace correct me, if I misunderstood things. Best regards, Chris |
Beta Was this translation helpful? Give feedback.
Replies: 1 comment
-
|
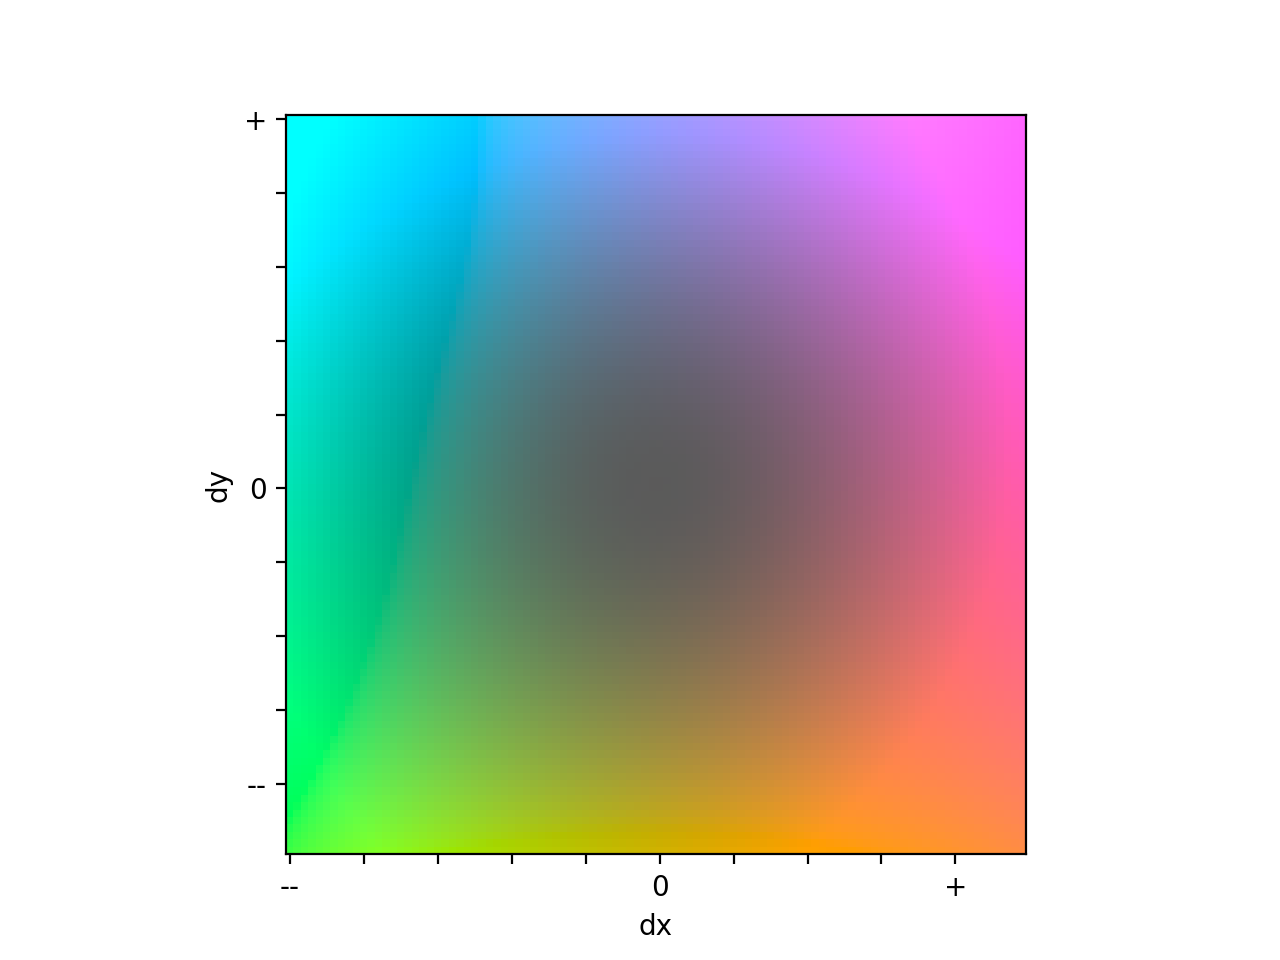
Hi @cwenge, To interpret the colors in the grid image, you can create this displacement legend using the following code: it should show this qualitative legend. So pixels that were pushed up and to the right are purple, those pushed down to the left are green, and so on. The colors in each grid image based on the values in that image though, so comparing the colors in two different displacement grid images may not be too helpful.
In this summary csv file, the "mean_rigid_D" and "mean_non_rigid_D" values indicate the average distance between automatically detected image features in the ''from" image (the one being warped) and the corresponding ones in the "to" image (the one the "from" image is being aligned to) after rigid and non-rigid warping, respectively. Something to consider here too is that these features were detected in much smaller images, and so may not be that precise of a measurement for the full resolution image. In fact, in the recent ACROBAT Grand Challenge, I found that the error estimated using these feature points was about three times worse than the actual error calculated using hand annotated tissue landmarks. In other words, the registration actually measured three times better than the error estimates suggested. I think they can still be helpful though, especially if trying to identify images that had especially good/bad alignments. I hope the above helps identify those alignments that didn't require altering the image very much. If you have any more questions, please don't hesitate to ask. Best, |
Beta Was this translation helpful? Give feedback.
Hi @cwenge,
So glad to hear you're finding valis useful! I put together a function that will summarize the transformations for each image, to help you gauge how much each image was warped. For the non-rigid transformations, it provides the minimum, mean, and maximum displacements, but you could edit the code to do a more detailed analysis. One thing is sometimes the really large displacements are outside the area you're interested in, so the image may not be as distorted as the summary values suggest.