Download the last GUI release and unzip (I did in /home/)
https://github.com/ailr16/BodePlot-DS1054Z/releases/tag/releaseGUIv1.1

-
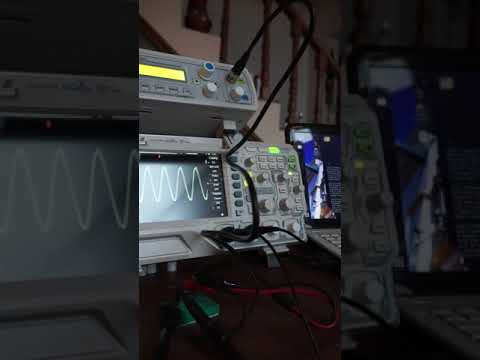
Turn on the oscilloscope, connect it through USB to PC and enable CH1 and CH2:

-
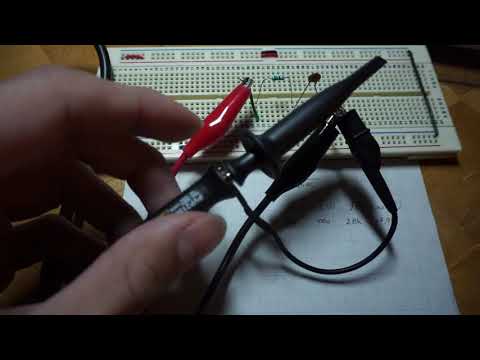
Connect the probes to testpoints:
a. CH1 from oscilloscope to the "circuit input"
b. CH2 from oscilloscope to the "circuit output"
c. CH1 from Waveform Generator to the "circuit input"


For this example we're gonna test an active low-pass filter (first order with simple 741) -
Turn on Waveform generator CH1 (if the CUT (Circuit Under Test) is an active circuit remember to energize before apply any signal on its inputs), and connect to PC through USB
NOTE: If the CUT inputs are under risk with high voltage signals remember to reduce amplitude BEFORE turning on the Output Channel

Example of Oscilloscope screen

-
Run BodePlot.py (from the release folder)
If your OS supports running Python scripts with double click just go ahead, otherwise open the path in a terminal and runpython bodePlot.py -
The main window will open
a. Select Oscilloscope and Generator ports from the lists

b. Enter the analysis parameters- Start Frequency
- End Frequency
- Frequency steps Total steps for the frequency sweep
- Max voltage Voltage peak of the sine wave (this value equals to Amplitude/2)
- Step delay Specifies the delay between each step of frequency sweep. The defaulot value is 0.7 but I recommend to increase it for a better result, in this case 1.2s

c. Press Run Analysis. Once the analysis is done, the plots will be showed
d. The plots can be hided with the checkboxes
e. You can save the measured data as CSV and the plot picture as PNG, just specify the path in the text box and press the button


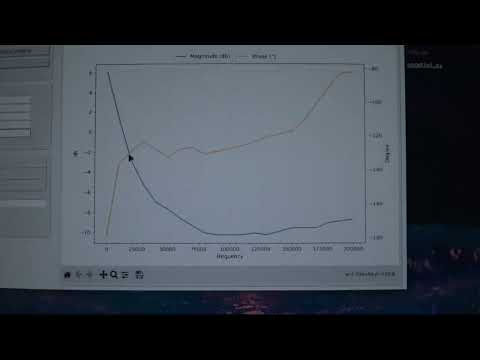
Here's an example of first-order active low-pass filter analysis with 100 steps. Theoretically. its cutoff frequency is near 7.2kHz, but is configured with gain of 2, so in this frequency we're gonna see more than 3dB. You can find the CSV in this file

- Connect probes to the circuit:
a. CH1 from Waveform Generator to the "circuit input"
b. CH1 from oscilloscope to the "circuit input"
c. CH2 from oscilloscope to the "circuit output" - Turn on Waveform generator CH1 and Oscilloscope CH2
- Run BodePlot.py
python BodePlot.py - Enter requested values
a. Start frequency. The initial frequency of test (Lower limit)
b. End Frequency. The final frequency for the test (Upper limit)
c. Frequency steps. The amount of steps which the range will be divided
d. Sine Wave Max Voltage. The Peak voltage for the generated sine wave
e. Oscilloscope ID. VISA oscilloscope ID. It's showed in the terminal