Hi,
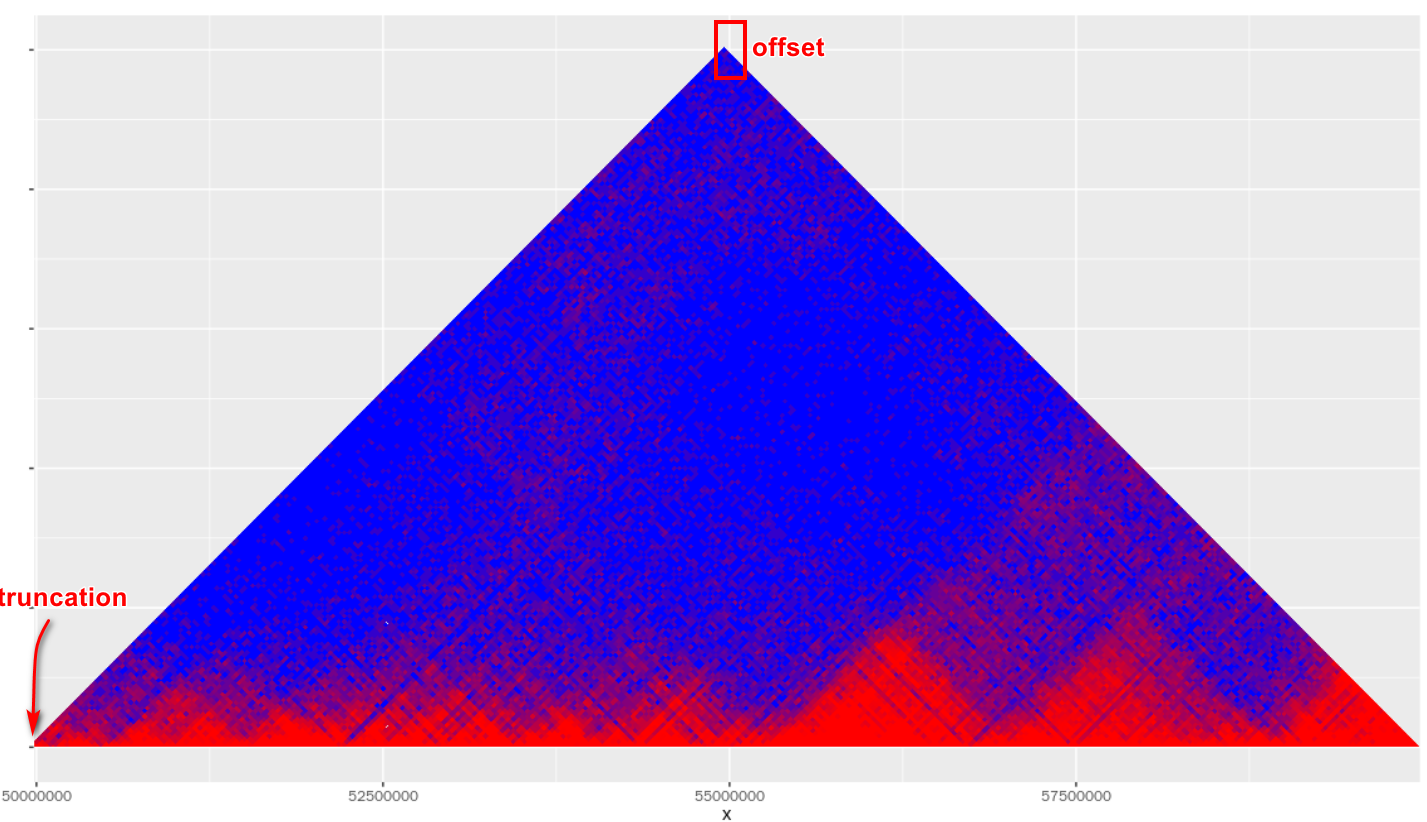
When using GenomeMatrix, I found that the plot seems to have a left offset (the vertices of the triangle are offset from the central axis, and the left vertex is truncated):
The codes I used:
library(HiTC)
library(ggplot2)
library(GenomeMatrix)
data(Dixon2012_IMR90, package="HiCDataHumanIMR90")
mat <- as.matrix( hic_imr90_40@.Data[[1]]@intdata )
granges <- hic_imr90_40@.Data[[1]]@xgi
# create plot
matrixPlotter( log2(mat+1), granges,
               plotGR=GRanges("chr1", IRanges( 50000000, 60000000 ) ),
               zlim=5, heightProp=1/2, extend=0, colPalette = c("blue", "red")) +
               scale_x_continuous(expand = c(0,0))
Hi,
When using
GenomeMatrix, I found that the plot seems to have a left offset (the vertices of the triangle are offset from the central axis, and the left vertex is truncated):The codes I used: