NYC Bike
https://github.com/mitchsw/nycbike
Build on Redis Hackathon entry, mitchsw, 2021-05-12.
A visual geospatial index of over 58 million bikeshare trips across NYC. This could be helpful to capacity plan across the network, allowing you to investigate aggregated rush hour and weekend travel patterns in milliseconds!
Live Demo: https://nycbike.mitchsw.com/
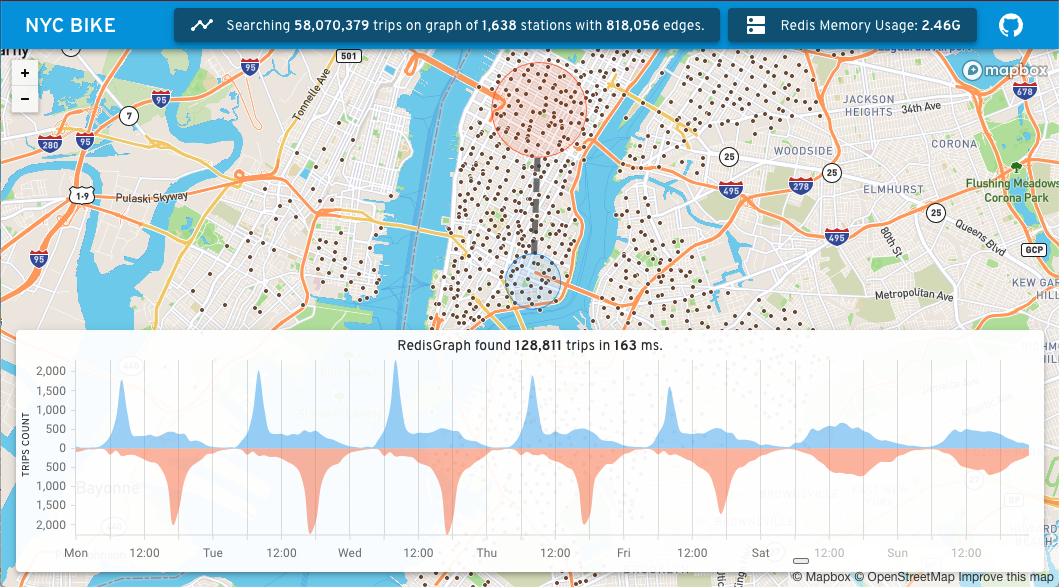 Full visual UI.
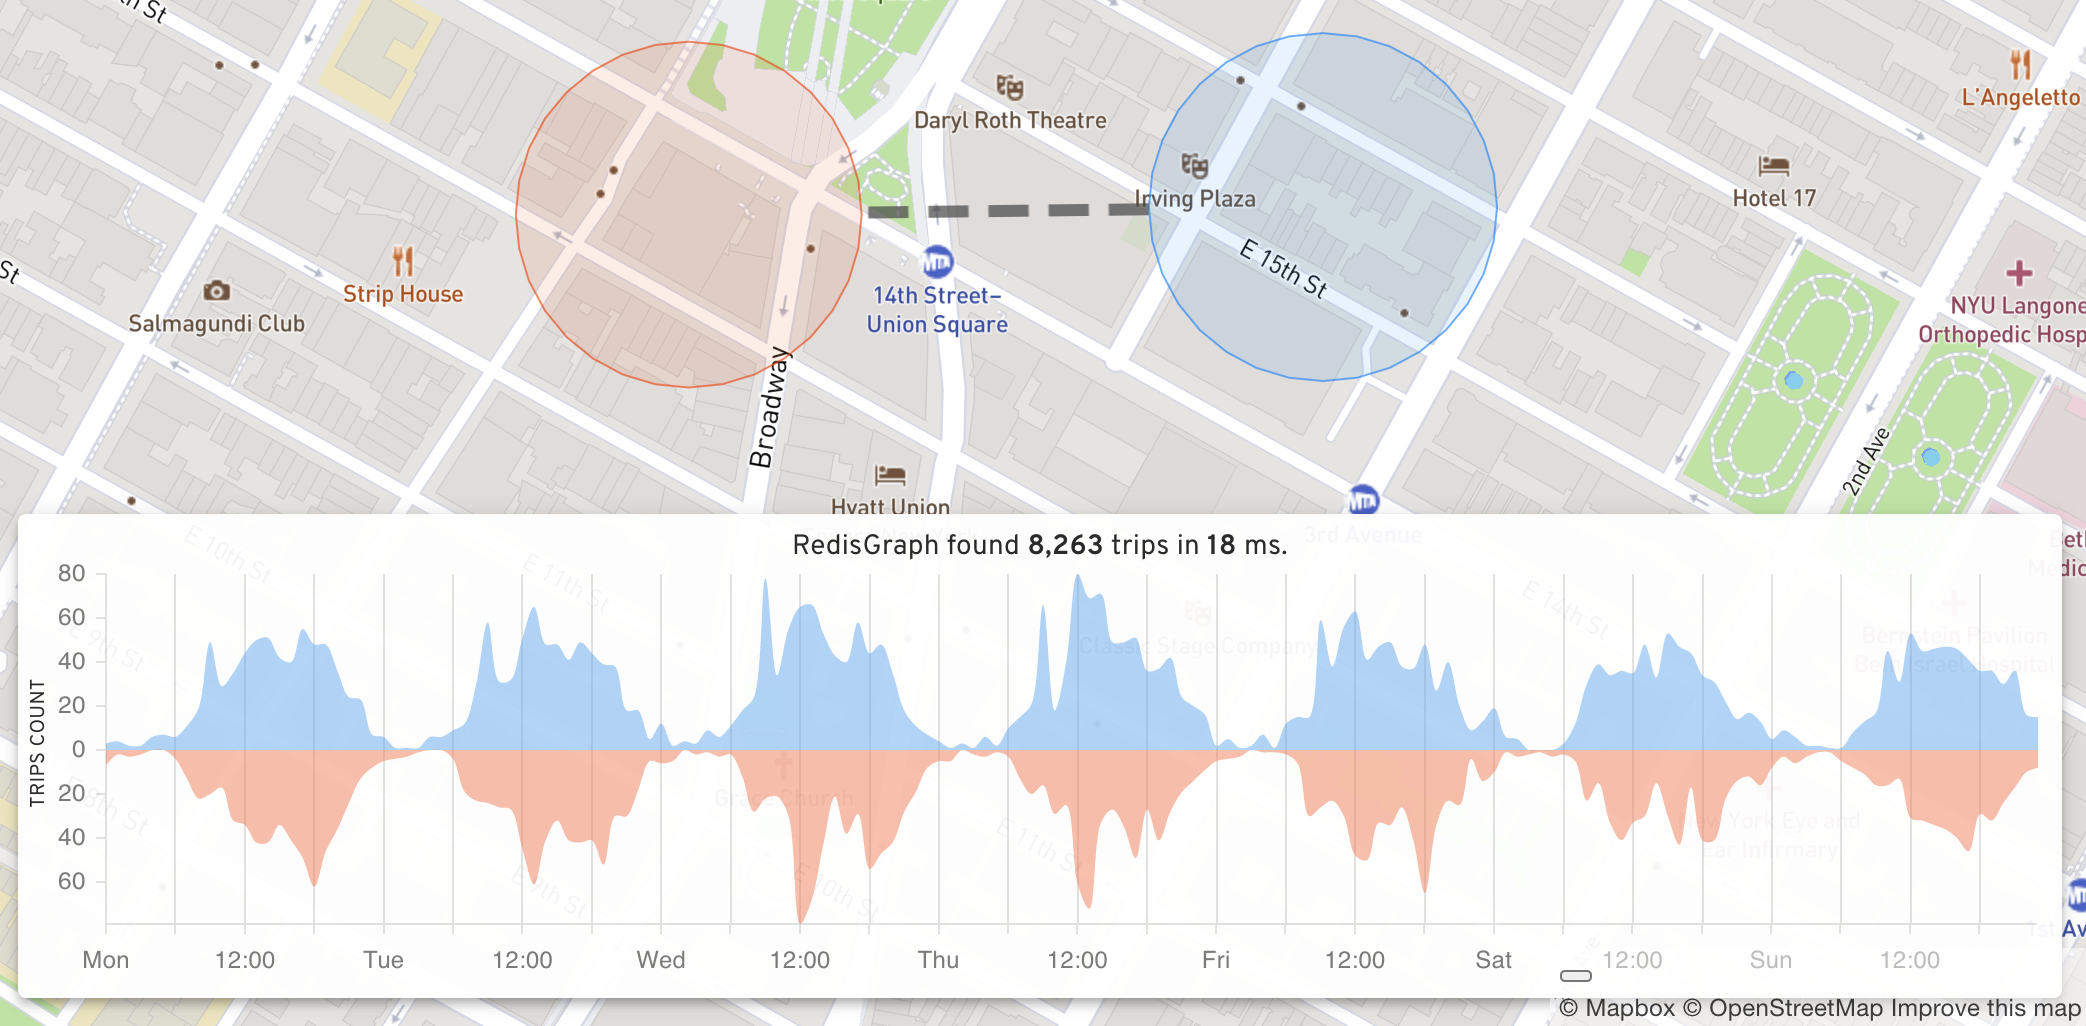 Zoomed-in view of trips between a few stations.
System Overview
The visual UI is built using:
- RedisGraph through redismod,
- a Go backend (behind an nginx reverse proxy),
- a React frontend.
This infrastructure can be started from docker-compose.yml.
This repo also includes a Go importer program to load the public dataset into RedisGraph.
redismod
This project uses the redismod Docker image. This was used (as per Hackathon requirements) instead Redis Enterprise Cloud as that did not yet support RedisGraph v2.4 (at time of development).
backend
The Go backend uses the redisgraph-go library to proxy graph queries from the frontend. The Go library didn't support the new point() type, so I sent PR redisgraph-go#45 adding this feature.
To mark every station on the map (/stations API call), a simple Cypher query is used to fetch all the locations:
MATCH (s:Station) RETURN s.loc
To count all the edges in the graph (part of /vitals API call), another simple Cypher query is used:
MATCH (:Station)-[t:Trip]->(:Station) RETURN count(t)
The main Cypher query to retrieve journeys (/journey_query API call) is of the form:
MATCH (src:Station)<-[t:Trip]->(dst:Station)
WHERE distance(src.loc, point($src)) < $src_radius
  AND distance(dst.loc, point($dst)) < $dst_radius
RETURN
  (startNode(t) = src) as egress,
  sum(t.counts[0]) as h0_trip_count,
  ...
This matches all the :Stations within the $src and $dst circles, and all the trip edges between these stations (in both directions). This is a fast query due to the geospatial index on :Station.loc (see offline_importer below). The returned egress is true if the trip started at $src, or false if it started at $dst. The aggregated trip graph presented on the UI is built by aggregating properties on these :Trip edges, for both egress and ingress traffic.
frontend
The frontend is built in React, built around react-mapbox-gl and custom drawing modes I implemented. The aggregated trip graph is built using devexpress/dx-react-chart.
This is my first ever React project, be nice! ;)
offline_importer
The offline importer iteratively downloads the public Citi Bike trip data, unzips each archive, and indexes all the trips into the journeys graph.
The graph contains every :Station as a node, an index on the station ID, and a geospatial index of the station's locations:
CREATE INDEX ON :Station(loc)
Each of the 58 million journeys are represented as increments on the edge between the src and dst stations (there are ~818k unique [src]->[dst] edges). The graph is setup to aggregate trips based on the trip time of the week (into 7*24 hour buckets). This graph could easily be extended to also aggregate trips on other dimensions too.
To index a single trip, the following Cypher query is used:
MATCH (src:Station{id: $src})
MATCH (dst:Station{id: $dst})
MERGE (src)-[t:Trip]->(dst)
ON CREATE
  SET t.counts = [n in range(0, 167) | CASE WHEN n = $hour THEN 1 ELSE 0 END]
ON MATCH
  SET t.counts = t.counts[0..$hour] + [t.counts[$hour]+1] + t.counts[($hour+1)..168]
This either creates a new edge with one trip, or increments the appropriate counter on the edge to index the trip.
To efficiently write all 56 million trips, I use pipelining and turn CLIENT REPLY OFF for each batch. The bulk import takes a couple of hours.
How to run
Create a Mapbox Access Token and write it to frontend/.env:
echo "REACT_APP_MAPBOX_ACCESS_TOKEN=<your-token>" > frontend/.env
Build the visual UI components, and run it using Docker Compose:
$ docker build -t nycbike backend
$ cd frontend; npm install; npm run-script build; cd ..
$ docker-compose up

redismod_1  | 1:C 13 May 2021 03:12:18.017 # oO0OoO0OoO0Oo Redis is starting oO0OoO0OoO0Oo
 [...]
backend_1   | 2021/05/13 03:09:35 Connected to Redis!
backend_1   | 2021/05/13 03:09:55 Found 58070379 trips, 1638 stations, 818056 edges. Memory usage: 2.46G
backend_1   | 2021/05/13 03:09:55 Running app on port 3000...
 [...]
nginx_1     | 172.18.0.1 - - [13/May/2021:03:13:02 +0000] "GET /api/journey_query?src_lat=40.715653603071786&src_long=-73.98651260399838&src_radius=0.7&dst_lat=40.75472153232781&dst_long=-73.98468539999953&dst_radius=1.2 HTTP/1.1" 200 1328 "http://localhost/" "Mozilla/5.0"
 [...]
The frontend should now be accessible at http://localhost:80/, but the map will be blank as Redis is empty. Now, start indexing the public dataset:
$ cd offline_importer
$ go run main.go --reset_graph=true
2021/05/12 22:58:45 [importer] Importer running...
2021/05/12 22:58:45 [importer] Resetting graph!
2021/05/12 22:58:45 [dww.0]: Started
2021/05/12 22:58:46 [importer] Scraping 1/164: https://s3.amazonaws.com/tripdata/201306-citibike-tripdata.zip
2021/05/12 22:58:47 [tripdata_reader] Opened file: 201306-citibike-tripdata.csv
2021/05/12 22:58:47 [dww.0]: Flushing 10000 commands, 9668 trips
2021/05/12 22:58:52 [dww.0]: Flushing 10000 commands, 9998 trips
2021/05/12 22:58:56 [dww.0]: Flushing 10000 commands, 10000 trips
2021/05/12 22:59:01 [dww.0]: Flushing 10000 commands, 10000 trips
2021/05/12 22:59:05 [dww.0]: Flushing 10000 commands, 10000 trips
Each reload of the UI at http://localhost:80/ should show these trips accumulate. On the live demo, I use a prebuilt dump.rdb which is 674MB on disk.
NYC Bike
https://github.com/mitchsw/nycbike
Build on Redis Hackathon entry, mitchsw, 2021-05-12.
A visual geospatial index of over 58 million bikeshare trips across NYC. This could be helpful to capacity plan across the network, allowing you to investigate aggregated rush hour and weekend travel patterns in milliseconds!
Live Demo: https://nycbike.mitchsw.com/
System Overview
The visual UI is built using:
This infrastructure can be started from docker-compose.yml.
This repo also includes a Go importer program to load the public dataset into RedisGraph.
redismod
This project uses the redismod Docker image. This was used (as per Hackathon requirements) instead Redis Enterprise Cloud as that did not yet support RedisGraph v2.4 (at time of development).
backend
The Go backend uses the redisgraph-go library to proxy graph queries from the frontend. The Go library didn't support the new
point()type, so I sent PR redisgraph-go#45 adding this feature.To mark every station on the map (
/stationsAPI call), a simple Cypher query is used to fetch all the locations:To count all the edges in the graph (part of
/vitalsAPI call), another simple Cypher query is used:The main Cypher query to retrieve journeys (
/journey_queryAPI call) is of the form:This matches all the
:Stationswithin the$srcand$dstcircles, and all the trip edges between these stations (in both directions). This is a fast query due to the geospatial index on:Station.loc(see offline_importer below). The returnedegressis true if the trip started at$src, or false if it started at$dst. The aggregated trip graph presented on the UI is built by aggregating properties on these:Tripedges, for both egress and ingress traffic.frontend
The frontend is built in React, built around react-mapbox-gl and custom drawing modes I implemented. The aggregated trip graph is built using devexpress/dx-react-chart.
This is my first ever React project, be nice! ;)
offline_importer
The offline importer iteratively downloads the public Citi Bike trip data, unzips each archive, and indexes all the trips into the
journeysgraph.The graph contains every
:Stationas a node, an index on the station ID, and a geospatial index of the station's locations:Each of the 58 million journeys are represented as increments on the edge between the
srcanddststations (there are ~818k unique[src]->[dst]edges). The graph is setup to aggregate trips based on the trip time of the week (into7*24hour buckets). This graph could easily be extended to also aggregate trips on other dimensions too.To index a single trip, the following Cypher query is used:
MATCH (src:Station{id: $src}) MATCH (dst:Station{id: $dst}) MERGE (src)-[t:Trip]->(dst) ON CREATE SET t.counts = [n in range(0, 167) | CASE WHEN n = $hour THEN 1 ELSE 0 END] ON MATCH SET t.counts = t.counts[0..$hour] + [t.counts[$hour]+1] + t.counts[($hour+1)..168]This either creates a new edge with one trip, or increments the appropriate counter on the edge to index the trip.
To efficiently write all 56 million trips, I use pipelining and turn
CLIENT REPLY OFFfor each batch. The bulk import takes a couple of hours.How to run
Create a Mapbox Access Token and write it to
frontend/.env:Build the visual UI components, and run it using Docker Compose:
The frontend should now be accessible at http://localhost:80/, but the map will be blank as Redis is empty. Now, start indexing the public dataset:
Each reload of the UI at http://localhost:80/ should show these trips accumulate. On the live demo, I use a prebuilt
dump.rdbwhich is 674MB on disk.