针对生物网站开发,如果涉及到基因组的展示,建议后端开发人员先学习了解以下基础知识:
- 基因的DNA双螺旋结构
- 碱基反向互补原则
- 中心法则
- 学习基因信息的存储方式以及格式的区别......
对于前端页面设计者,最有挑战的是设计灵活、符合项目需求的DNA可视化界面。此处的灵活可能包括的功能有:
- 像文本工具一样的选择、复制、粘贴、搜索、插入等功能;
- 定位查找;
- zoom in and out;
- 不同属性的部分展示不同的样式;
- 根据用户操作实时变化试图;
生物数据库众多,不同分类标准有对应不同的数据库,但是最常用的有:
最常见的主要是以下几种:
- FASTA
- FASTQ
- GFF/GTF
- SAM
- BAM
- 其他
在有的情况下可能需要我们自己解析GenBank格式的文件, 而解析方法可以直接使用biopython
- QC: fastqc, multiqc
- Reads to contigs: velvet, SPAdes, Cufflinks...
- Align reads to reference sequence: SHRiMP, Bowtie2, BWA, tophat...
- Variant identification: GATK
- SAMTools
- bedtools
- Alignment:
- BLAST
- Clustal Omega
- Clustalw2
- Kalign
- MAFFT
- MUSCLE
- BioPython ! ! ! ! !
- IGV官网(可下载桌面应用),IGV.js浏览器插件
- Embed the UCSC genome browser graphic in your web page
- GIVE - Genomic Interaction Visualization Engine
- NCBI Graphical Sequence Viewer Embedding API, Using the Sequence Viewer Embedding API
- JBrowse Configuration Guide, GitHub
- WebApollo Configuration
- Epigenome
还有些github开源项目:
- Plotly.js
- CanvasJS
- TOAST UI Chart
- GoJS is a JavaScript diagramming library for interactive flowcharts, org charts, design tools, planning tools, visual languages.
- C3.js is a D3-based reusable chart library.
- dimple is an object-oriented API for business analytics powered by D3.
- Charted, by Medium, is a tool that automatically visualizes data. You just give it a link to a data file. (You can read more about it at Medium.)
- Smoothie Charts can be helpful, if you are dealing with stream real-time data.
- Chartkick.js is a library that allows you to create beautiful charts with one line of JavaScript.
- Morris.js is a powerful library with a clean interface. It allows you to create good-looking charts with ease. It’s based on jQuery and the Raphaël JavaScript library.
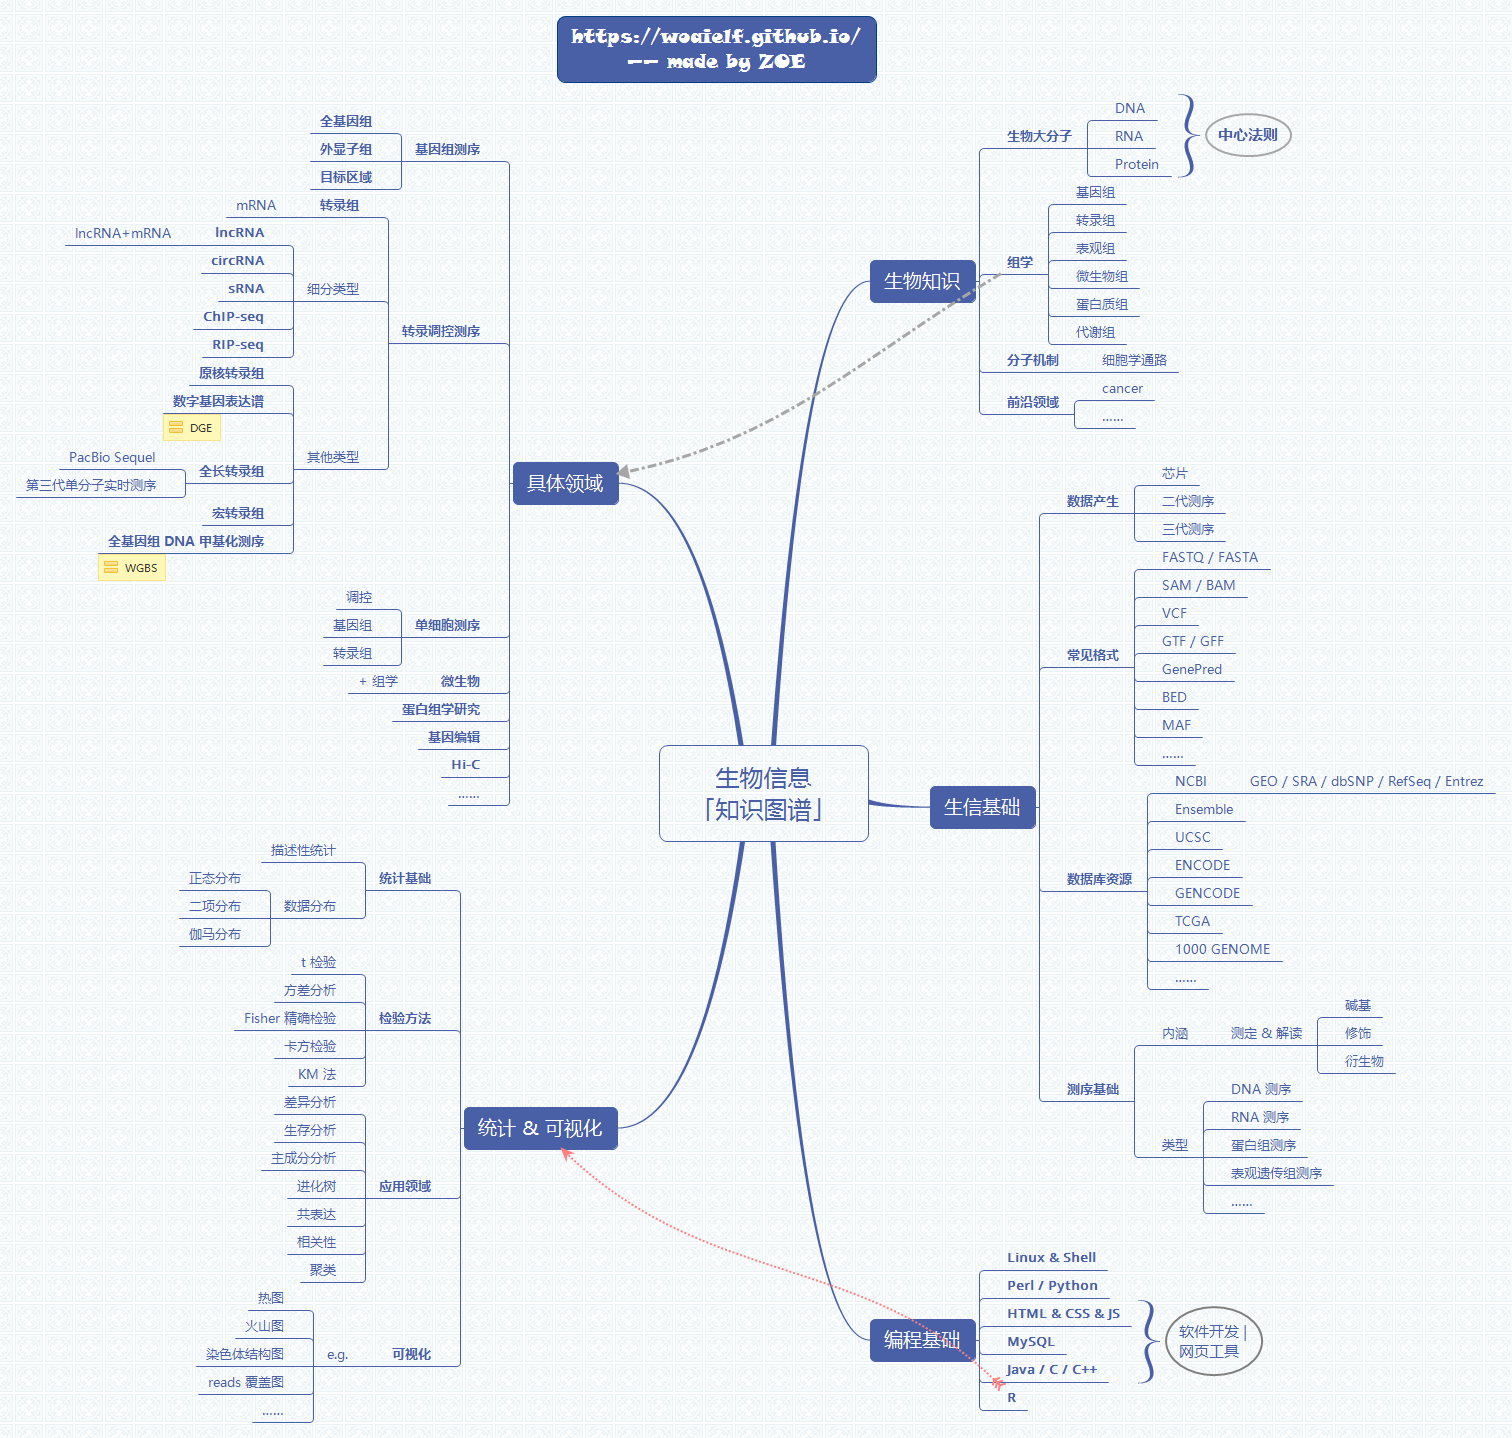
made by @jmzeng1314