dashboard
Phase 3 turns the browser dashboard into the go-to surface for both audiences. Every panel below renders from live server payloads over the existing WebSocket protocol, so nothing needs a page reload.
The overview capture below exists
(images/dashboard.png); the other four are
still open.

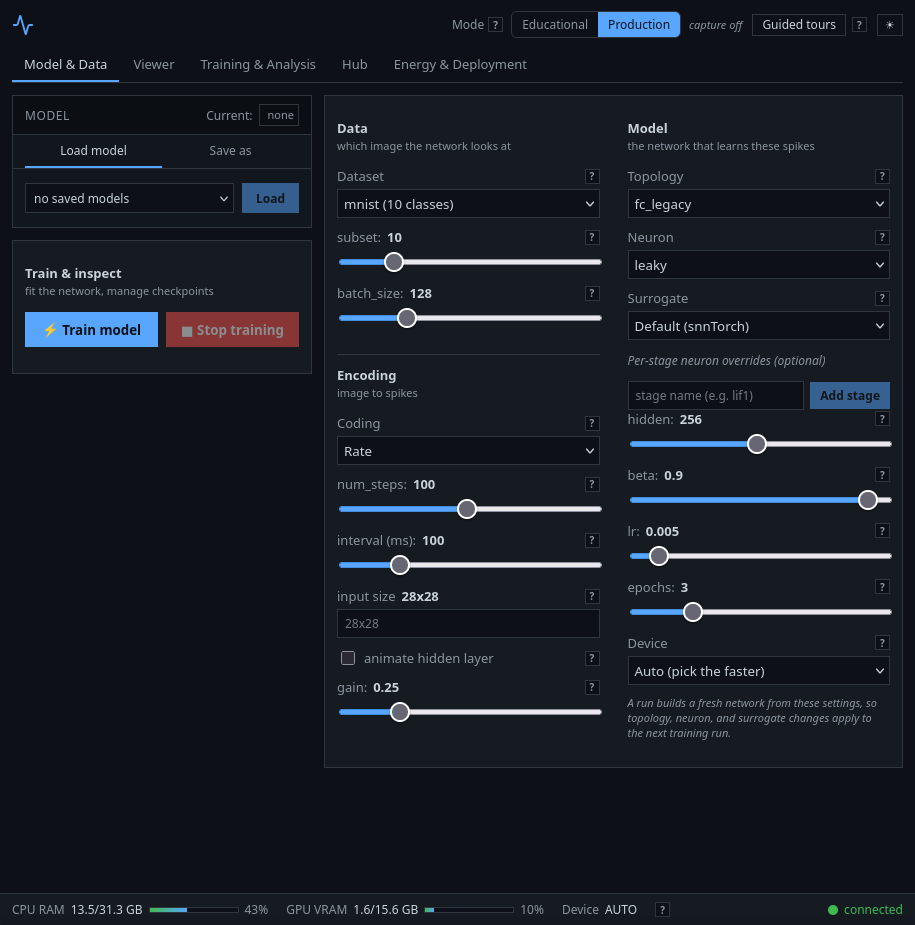
Maintainer note — partial: one of five captures done. The overview above was captured from a real browser session. The remaining four were not, because this repository is often prepared in a headless environment with no browser. Do not fake an image; capture the following from a real browser session and link them from this section:
Dashboard overview— done, see above.- Training run — the live loss/accuracy charts mid-run.
- NIR graph viewer and drift-validation panel — a topology graph and its
within_tolerancereport.- Hub panel — entry cards, a compat badge, and an import verdict.
- Demo GIF — apply-and-run streaming spike frames into the raster.
To reproduce:
./install.sh, thenspikeforge-server(port 8877) andcd client && npm install && npm run dev; open http://localhost:5173. Commit the captures under the top-levelimages/directory (the gitignoredbuild/anddocs/trees are not suitable) and link them here.
The top bar carries an Educational / Production toggle wired to
TrainConfig.mode — the same ExecutionMode the runtime uses. It changes
what a run records, not what it computes:
- Production (the default) skips trajectory capture and runs lean, so the introspection panels show their gated empty state.
-
Educational records per-step
U[t]/I[t]/S[t]and unlocks the trajectory viewer, the metrics panel, and the firing-rate histogram.
The mode is applied when the engine is built, so switch it and then start a
run (train) or load a checkpoint (load_model) to see the panels fill in.
-
Topology picker ->
TrainConfig.topology(fc_legacy,fc_small,conv_net,recurrent_net). -
Neuron picker ->
TrainConfig.topology_params.neuron(registry kinds). -
Surrogate picker ->
TrainConfig.topology_params.surrogate; it also drives the surrogate-curve panel's initial selection. - The existing dataset and coding controls (rate / latency / delta / random) and the model-zoo browser.
The hardware-target picker is deferred to Phase 5 (see Notes).
-
Neuron-state trajectory viewer —
U[t](membrane) andI[t](input current) per stage, with a stage selector and the shared time cursor. - NIR topology graph viewer — the graph summary drawn as nodes and edges, with non-linear (skip/conv) and delayed (recurrent) edges rendered distinctly.
-
NIR drift-validation panel — the independent-interpreter
ValidationReport, per layer and overallwithin_tolerance. - The existing sample / spike-frame / reconstruction / raster panels.
- Trajectory metrics — firing rate, sparsity, and ISI per stage, plus a firing-rate histogram.
- Encoding report — reconstruction plus the approximation note for the current sample (see the Phase 2 decoding caveats).
-
Surrogate-derivative curve — sampled
dS/dUfor the selected surrogate gradient. - Benchmark readout — config, environment, and per-mode timing/memory.
- The training and prediction panels.
Seven short in-app lessons (one per tutorial theme) launch from the Tours menu in the top bar. Each step highlights its target control or panel and explains what it does:
| Lesson | Theme |
|---|---|
encoding |
Spike encoding |
datasets |
Neuromorphic datasets |
snn |
Spiking neural networks (neuron model, mode, state viewer) |
training |
Training SNNs (surrogate, curve, loss/accuracy) |
cnn |
Spiking CNNs (topology, graph viewer) |
recurrent |
Recurrent SNNs (delayed edges) |
nir |
NIR export, validation, and benchmarking |
Targets are marked with data-tour attributes on the panels. A step whose
target is gated (for example the trajectory viewer in production mode) shows
its explanatory note instead of a highlight. The help tips are expanded to
cover topology, neuron model, mode, and NIR concepts.
The dashboard drives the server with the actions below; precondition
failures emit the existing error message rather than raising.
| Action | Reply | Mode / precondition |
|---|---|---|
configure |
config_ack, sample panels |
needs an encode config |
run / stop
|
run_state, rasters |
needs a configured sample |
select_sample |
sample panels | needs a configured sample |
infer |
inference |
needs a trained/loaded model |
train / stop_train
|
train_metrics, train_state
|
builds the engine; applies mode
|
save_model |
model_saved |
needs a name |
load_model |
model_loaded |
needs a saved name; applies mode
|
delete_model / new_model
|
model_list / model_cleared
|
— |
list_models |
model_list |
— |
stats |
system_stats |
— |
cancel_download |
download_state |
— |
nir_export |
nir_graph |
active or configured topology |
nir_validate |
nir_validation |
needs a configured sample |
trajectory |
trajectory |
educational mode + active model |
metrics |
metrics |
educational mode + active model |
encoding_report |
encoding_report |
needs a configured sample |
surrogates |
surrogate_list |
— |
surrogate_curve |
surrogate_curve |
needs a surrogate name |
benchmark |
benchmark |
runs the tiny default fixture |
model_search / model_diff
|
model_search / model_diff
|
registry search and metadata diffing |
deployment_report |
deployment_report |
capability matrix for a target |
deploy_run |
backend_run |
compile + run on a backend, with rewrite/compare |
energy_report |
energy_report |
SOP/MAC/AC accounting for a target |
hub_list / hub_search
|
hub_list / hub_search
|
curated catalog browse + search |
hub_download / hub_cancel
|
hub_download_state |
isolated download with progress/cancel |
hub_inspect / hub_import
|
hub_inspect / hub_import
|
structure report + compat verdict |
The schema also still declares a legacy predict type, but the client no
longer sends it and the server does not dispatch it.
/ws and GET /api/bundle/<name> are open by default (unchanged from
earlier phases). An operator exposing the dashboard beyond localhost can
set SPIKEFORGE_DASHBOARD_TOKEN to gate both, and
SPIKEFORGE_DASHBOARD_MAX_CONCURRENT_JOBS to cap how many train /
run_pipeline jobs run at once server-wide -- a request past that cap gets
a server busy error message rather than queuing silently. See
Usage — Access control & rate limiting
for the docker-compose configuration.