Code Snippets
Using weewx-GTS
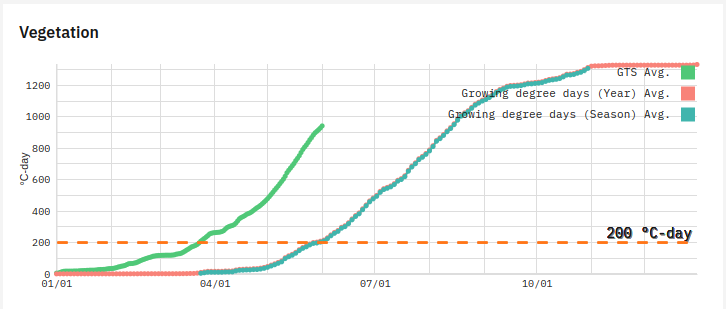
Add a combined diagram of GTS, yearGDD and seasonGDD in skin.conf.
[DisplayOptions]
    [[diagrams]]
        [[[combined_observations]]]
            [[[[vegetation]]]]
                label = "Vegetation"
                aggregate_type = avg
                markerValue = 200
                markerColor = "#FF7518"
                yScaleMin = 0
                pointSize = 3
                [[[[[obs]]]]]
                    [[[[[[GTS]]]]]]
                        observation = GTS
                        aggregate_interval = 86400  # 1 day
                        curve = "linear"
                        color = "#50C878"
                    [[[[[[yearGDD]]]]]]
                        observation = yearGDD
                        curve = "linear"
                        color = "#F88379"
                    [[[[[[seasonGDD]]]]]]
                        observation = seasonGDD
                        curve = "linear"
                        color = "#40B5AD"
This can be used with the month, year and alltime timespans:
[DisplayOptions]
    ...
    [[diagrams]]
        ...
        [[[month]]]
            ...
            [[[[observations]]]]
                [[[[[vegetation]]]]]
                ...
        [[[year]]]
            ...
            [[[[observations]]]]
                [[[[[vegetation]]]]]
                ...
        [[[alltime]]]
            ...
            [[[[observations]]]]
                [[[[[vegetation]]]]]
                ...
Using weewx-xcumulative
Add a combined diagram of Total rain and cumulative rain for different time spans:
Day:
[[diagrams]]
    ...
    [[[combined_observations]]]
        [[[[rain_cum_sum]]]]
            label = 'Rain Total / Cumulative'
            yScaleMin = 0
            [[[[[obs]]]]]
                [[[[[[rain_sum]]]]]]
                    observation = "rain"
                    aggregate_type = sum
                    aggregate_interval = 7200 # 2 hours
                [[[[[[rain_cum]]]]]]
                    observation = "rain"
                    color = "#ffc000"
                    type = line
                    aggregate_type = cumulative
                    aggregate_interval = 7200 # 2 hours
                    reset = midnight
                    curve = linear
Month:
[[diagrams]]
    ...
    [[[combined_observations]]]
        [[[[rain_cum_sum]]]]
            label = 'Rain Total / Cumulative'
            yScaleMin = 0
            [[[[[obs]]]]]
                [[[[[[rain_sum]]]]]]
                    observation = "rain"
                    aggregate_type = sum
                    aggregate_interval = 172800 # 2 days
                [[[[[[rain_cum]]]]]]
                    observation = "rain"
                    color = "#ffc000"
                    type = line
                    aggregate_type = cumulative
                    aggregate_interval = 86400 # 1 day
                    reset = month
                    curve = linear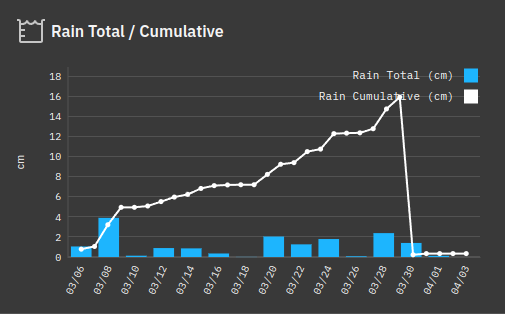
Year:
[[diagrams]]
    ...
    [[[combined_observations]]]
        [[[[rain_cum_sum]]]]
            label = 'Rain Total / Cumulative'
            yScaleMin = 0
            bottom_date_time_format = "%b"
            [[[[[obs]]]]]
                [[[[[[rain_sum]]]]]]
                    observation = "rain"
                    aggregate_type = sum
                    aggregate_interval = month # 18 days
                [[[[[[rain_cum]]]]]]
                    observation = "rain"
                    color = "#ffc000"
                    type = line
                    aggregate_type = cumulative
                    aggregate_interval = 345600 # 4 days
                    reset = year
                    curve = linear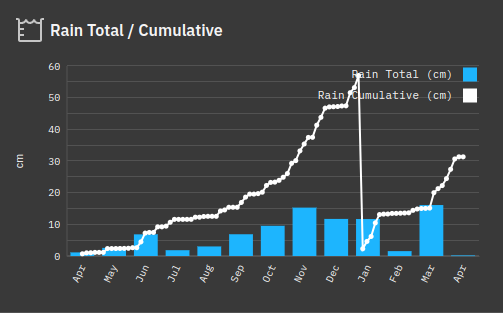
Statistics:
[[diagrams]]
    ...
    [[[combined_observations]]]
        [[[[rain_cum_sum]]]]
            label = 'Rain Total / Cumulative'
            yScaleMin = 0
            [[[[[obs]]]]]
                [[[[[[rain_sum]]]]]]
                    observation = "rain"
                    aggregate_type = sum
                    aggregate_interval = month
                [[[[[[rain_cum]]]]]]
                    observation = "rain"
                    color = "#ffc000"
                    type = line
                    aggregate_type = cumulative
                    reset = year
curve = linearFirst, add the configuration to skin.conf, under the combined_observations key:
[[[combined_observations]]]
    [[[[my_custom_chart]]]]
        label = "My custom Chart"
        curve="natural"
        [[[[[obs]]]]]
            [[[[[[rain]]]]]]
                observation = "rain"
            [[[[[[outTemp]]]]]]
                observation = "outTemp"
Then, add this to the template where you want the chart to be rendered.
<div class="bx--row">
    #set global $comb_obs = "my_custom_chart"
    #set global $combined_diagram = $DisplayOptions.get("diagrams", {}).get("combined_observations", {}).get('my_custom_chart', {})
    #set global $diagram_index = 9999
    #include "includes/combined-diagram-tile.inc"
 </div>
This assumes, that you add the chart to a context page, eg. index.html, week.html, month.html, year.html, etc. This way the TimeSpan will be set automatically. If you want to set the TimeSpan manually, you can do so setting the following:
<div class="bx--row">
    #attr $context = 'custom'
    #set global $context_start_ts = 1672537657
    #set global $context_end_ts = 1675129657
    #set global $diagram_classes_custom = "bx--col"

    #set global $comb_obs = "my_custom_chart"
    #set global $combined_diagram = $DisplayOptions.get("diagrams", {}).get("combined_observations", {}).get('my_custom_chart', {})
    #set global $diagram_index = 9999
    #include "includes/combined-diagram-tile.inc"
</div>
#attr $context = 'custom' Set a custom context
#set global $context_start_ts Set a custom start time, needs to be a timestamp.
#set global $context_end_ts Set a custom end time, needs to be a timestamp.
You can use https://www.epochconverter.com/ to get the timestamp of a specfic date.
#set global $diagram_classes_custom = "bx--col" Per default the diagrams are rendered in a 3 column layout. If you want to change this, you can set the classes here. For example, if you want to render the diagram over the whole page, just use "bx--col".
<div class="bx--row">
    <div class="bx--col">
        <div class="bx--tile">
            <p>Place your content here</p>
        </div>
    </div>
</div>

<div class="bx--row">
    <!--Column 1-->
    <div class="bx--col-sm-4 bx--col-md-8 bx--col-lg-12 bx--col-xlg-6">
        <div class="bx--tile">
            <p>Place your content here</p>
        </div>
    </div>
    <!--Column 2-->
    <div class="bx--col-sm-4 bx--col-md-8 bx--col-lg-12 bx--col-xlg-6">
        <div class="bx--tile">
            <p>Place your content here</p>
        </div>
    </div>
</div>

<div class="bx--row">
    <!--Column 1-->
    <div class="bx--col-sm-4 bx--col-md-8 bx--col-lg-12 bx--col-xlg-6" style="margin-bottom: 1rem;">
        <div class="bx--tile">
            <p>Place your content here</p>
        </div>
    </div>
    <!--Column 2-->
    <div class="bx--col-sm-4 bx--col-md-8 bx--col-lg-12 bx--col-xlg-6" style="margin-bottom: 1rem;">
        <div class="bx--tile">
            <p>Place your content here</p>
        </div>
    </div>
    <!--Column 3-->
    <div class="bx--col-sm-4 bx--col-md-8 bx--col-lg-12 bx--col-xlg-6" style="margin-bottom: 1rem;">
        <div class="bx--tile">
            <p>Place your content here</p>
        </div>
    </div>
    <!--Column 4-->
    <div class="bx--col-sm-4 bx--col-md-8 bx--col-lg-12 bx--col-xlg-6" style="margin-bottom: 1rem;">
        <div class="bx--tile">
            <p>Place your content here</p>
        </div>
    </div>
</div>

Tip: bx--tile renders a tile component, the 2 Column layout without tiles would look like this:
<div class="bx--row">
    <!--Column 1-->
    <div class="bx--col-sm-4 bx--col-md-8 bx--col-lg-12 bx--col-xlg-6">
        <p>Place your content here</p>
    </div>
    <!--Column 2-->
    <div class="bx--col-sm-4 bx--col-md-8 bx--col-lg-12 bx--col-xlg-6">
        <p>Place your content here</p>
    </div>
</div>

For more about IBM Carbon Grid System, see https://carbondesignsystem.com/guidelines/2x-grid/implementation