Releases: LetPeopleWork/Lighthouse
Lighthouse v26.5.24.10

5251329 huserben
Benjamin Huser-Berta
huserben
Benjamin Huser-Berta
Exclude Items for Throughput (Premium)
Does your team carry maintenance, support, or unplanned bug work alongside feature delivery? Until now that left you two options: live with throughput numbers polluted by interrupt work — and forecasts that are too optimistic — or split things into a "fake team" that doesn't actually exist in your tracker. Neither is great.
The new Exclude Items for Throughput rule lets you tell Lighthouse "don't count these": exclude by type, by parent reference, by tags, or any combination of conditions. The filter then flows through every forecast — How Many, When, and Backtesting — so the dates you commit to reflect the work your team actually does, not the noise around it.
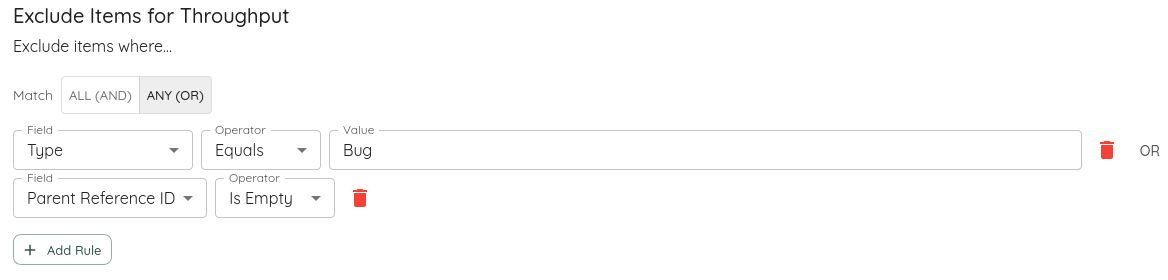
It's also a conversation tool. Want to show leadership how much faster you'd ship if the team could focus? Run When will this be done? against your raw throughput, then against the filtered throughput, and compare. You've always known the interrupt work matters — now you have the numbers to put behind it.
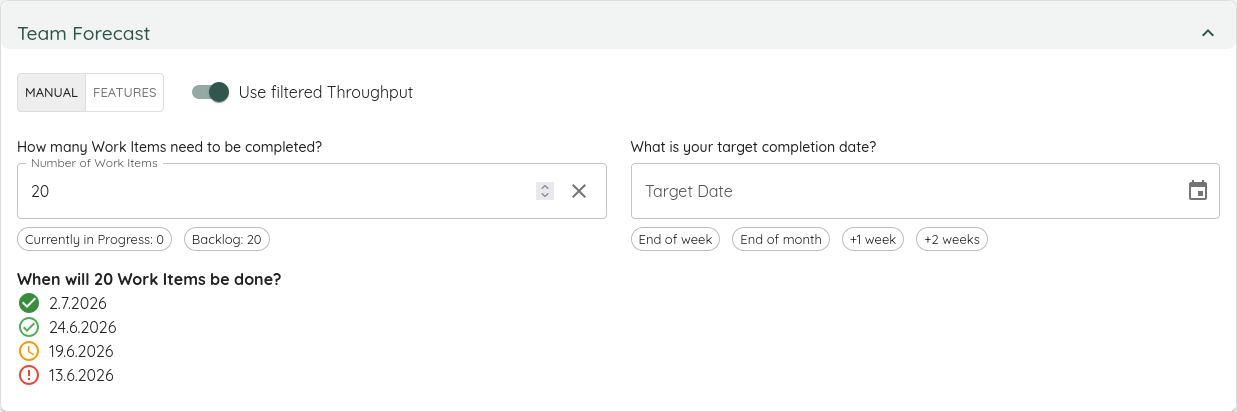
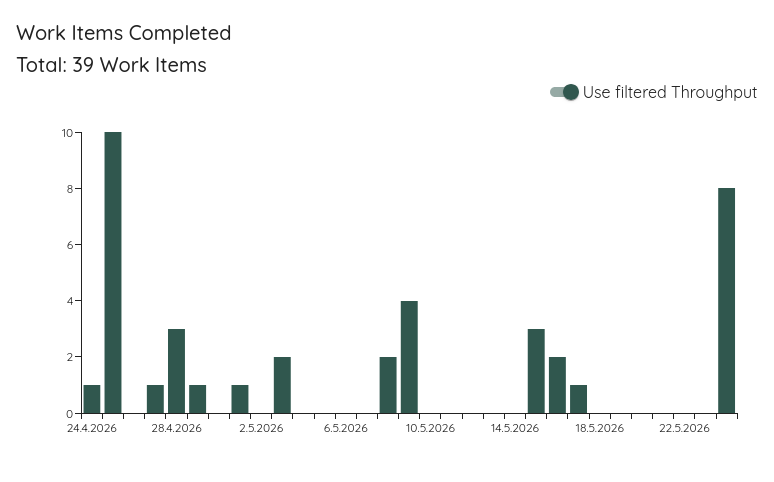
The same idea extends to your metrics: a toggle on the Throughput Run Chart, Throughput Process Behaviour Chart (bars and the Average / UNPL / LNPL bounds), and Predictability Score Details lets you flip between raw and filtered views without leaving the page. The team's Quick Settings shows an indicator whenever a filter is active, so you always know which world you're looking at.
The rule builder works wherever rules are used in Lighthouse — including the Portfolio Delivery editor — and it picked up new conditions along the way:
- Does Not Contain
- Is Empty / Is Not Empty — match
null, empty string, or a missing field; no value input required. - AND / OR group mode for combining rules.
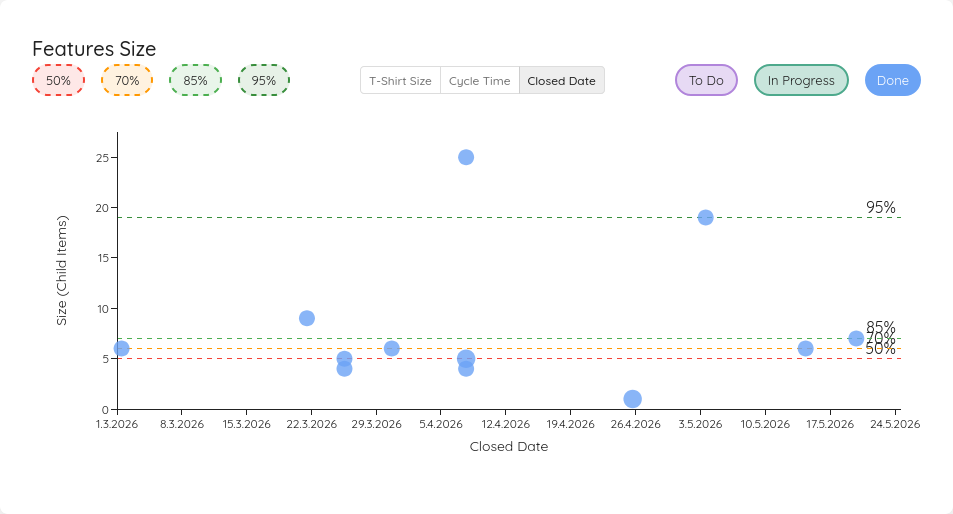
Feature Size — View by Closed Date
The Feature Size chart got a third Show by mode alongside Estimation Unit and Cycle Time: Closed Date. Picking Closed Date flips the axis (date on X, size on Y), rotates the percentile bands accordingly, and parks any in-flight (not-yet-closed) feature at the Today marker so it stays visible in context.
Documentation Light Mode
The docs site now ships a light / dark color-scheme toggle. The site still defaults to following your OS preference; you can pin either mode explicitly from the header.
Bugfixes and Improvements
- Jira Data Center: 504 Gateway Timeout on team sync — the Jira client used a fixed page size of 1000, which Data Center instances behind a slow reverse proxy can't always return inside their gateway timeout window. Page size is now configurable on the Jira connection (defaulting to 1000 as before).
- Forecast Backtesting: Historical Window (Days) clear behaviour — clearing the Historical Window (Days) field used to snap the value back to
1on every keystroke, forcing you to type156to enter56. The value now clamps on blur instead of on every keystroke, so clear-and-retype works the way you'd expect. - Started Date reset when reverting to the To-Do state — if you moved an item To Do → Doing → To Do → Done (skipping Doing on the second pass), Lighthouse kept the original Started Date set on the first transition. Started and Closed now match for items that never actually re-entered an in-progress state. Applies across Jira, Azure DevOps, and Linear.
- Updated various third-party libraries.
Contributions ❤️
Special thanks to everyone who contributed feedback for this release:
- Liz Rettig
- Evgeniy Stepchenko
- Alex Priestley
- Gabor Bittera
- Will Pyke
- Gordon Price
Lighthouse v26.5.19.1
363989b
huserben
Benjamin Huser-Berta
OAuth Authentication for Work Tracking Systems
Lighthouse can now connect to Jira and Azure DevOps through OAuth, alongside the existing Personal Access Token flow. OAuth is a Premium feature: pick OAuth in the connection wizard, register a client on the IdP side, and Lighthouse drives the rest — token exchange, refresh, and reconnect.
- Jira via Atlassian 3LO, with Jira Software granular scopes.
- Azure DevOps via Microsoft Entra ID, with
vso.work_writeand per-tenant configuration. - Automatic token refresh with single-flight serialization, so concurrent requests can't double-refresh and burn rate limits.
- Disconnected-state surfacing — a status icon on the connection list flags connections that need attention, and a Reconnect banner walks you through the popup-based OAuth handshake without leaving the connection edit dialog.
IdP-side setup is documented under the existing work-tracking-system pages: Jira and Azure DevOps.
API Key Scopes on the Listing
The API Keys settings page now shows each key's scope set in place of the Created By column. The scope column makes it obvious at a glance which Teams and Portfolios a given key can act on. The Scopes column is shown only when RBAC is enabled.
Bugfixes and Improvements
- Cache thread-safety under concurrent metric requests —
Cache<TKey,TValue>was backed by a plainDictionary<,>; under concurrent metric load (multiple teams, background services racing user requests) the dictionary could corrupt and start throwingIndexOutOfRangeExceptionon every subsequent call to the affected key, until process restart. Switched toConcurrentDictionary. Reported by Liz with a detailed diagnosis and reproduction. - Setting Feature WIP from a Portfolio — the Portfolio → Team feature-WIP update returned HTTP 500 because the RBAC scope check on
ForecastController.UpdateForecastForProjectran against the wrong entity. The update did persist, but the error was disruptive. Fixed. - Forecasts refresh in place after Feature WIP changes — previously you had to navigate away and back for the new forecast dates to show up. Forecasts now update immediately, so the impact of a WIP change is visible without losing your place.
- Updated various third-party libraries.
Contributions ❤️
Special thanks to everyone who contributed feedback for this release:
Lighthouse v26.5.14.2
Role-Based Access Control
This release introduces Role-Based Access Control (RBAC) — a Premium feature for fine-grained control over who can read and edit teams and portfolios. RBAC builds on top of OIDC authentication and is configured under Settings → Access.
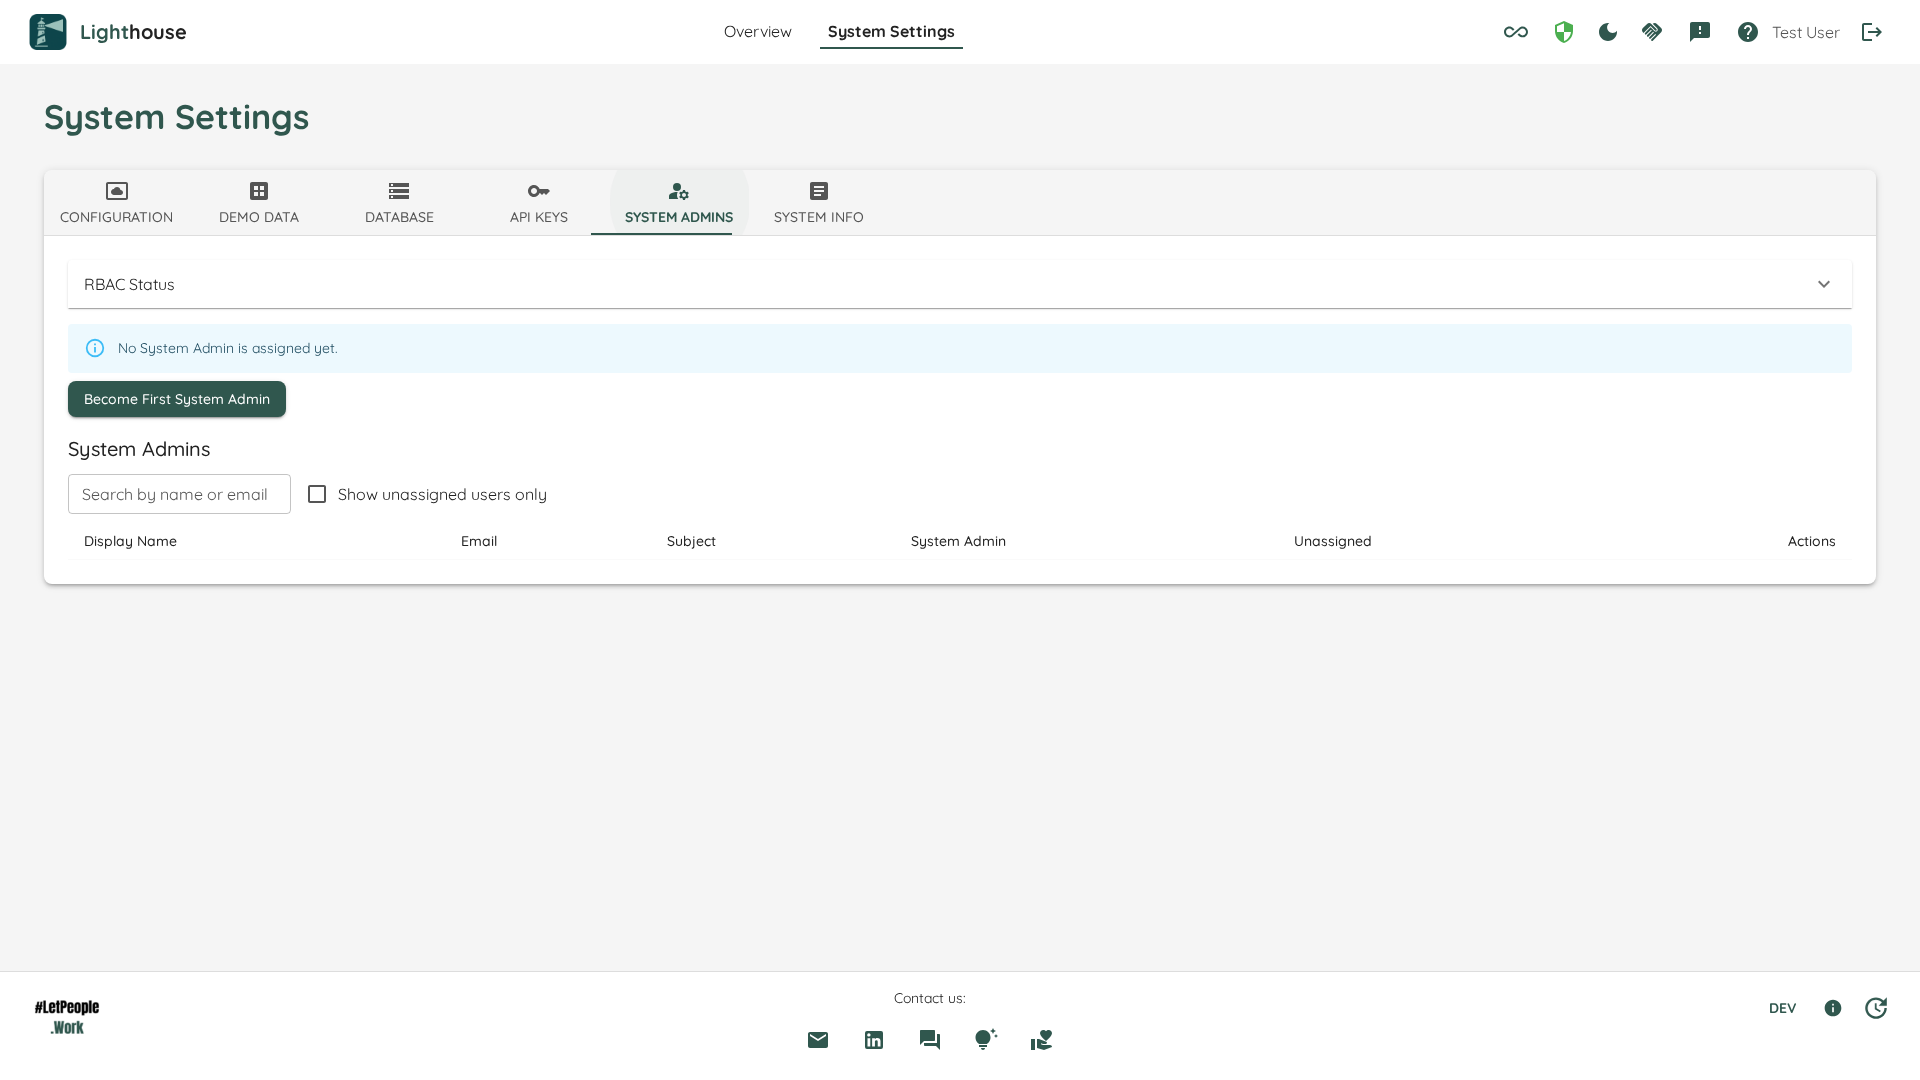
What the four roles can do
- System Admin — full control. Manages users, group mappings, and connections; creates, edits, clones, and deletes teams and portfolios.
- Team Admin (scoped to a specific team) — reads and edits the assigned team's settings, throughput, features, and metrics.
- Portfolio Admin (scoped to a specific portfolio) — reads and edits the assigned portfolio's features, settings, and metrics.
- Viewer (scoped to a team or portfolio) — read-only access to the assigned entity.
In v1, only System Admin creates, clones, or deletes teams and portfolios. Team Admin and Portfolio Admin edit their assigned scope but cannot create new entities. We may widen this in a future release based on feedback.
Key invariants
- Portfolios require at least one team to exist somewhere in the system. The Add Portfolio button stays hidden until the first team is created — including for System Admin and during first-time bootstrap. A portfolio without any team to roll up is structurally meaningless.
- First-time bootstrap is open by design. Until you've granted the first System Admin via Become First System Admin, every authenticated user has system-admin-equivalent rights — so they can upload the Premium license, configure the work-tracking system, and bootstrap themselves. The system locks down to the granted System Admin (and any configured Emergency Admins) once that step completes.
- Emergency Admins are a recovery path. Users listed in
Authentication.EmergencySystemAdminSubjectsretain System Admin rights even if their database role is removed. Their UI row shows an Emergency Admin badge and the Revoke button is hidden. - SSO group mappings are first-class. Map an IdP group to a role at a specific scope; users in that group inherit the role behaviourally identically to a direct user grant.
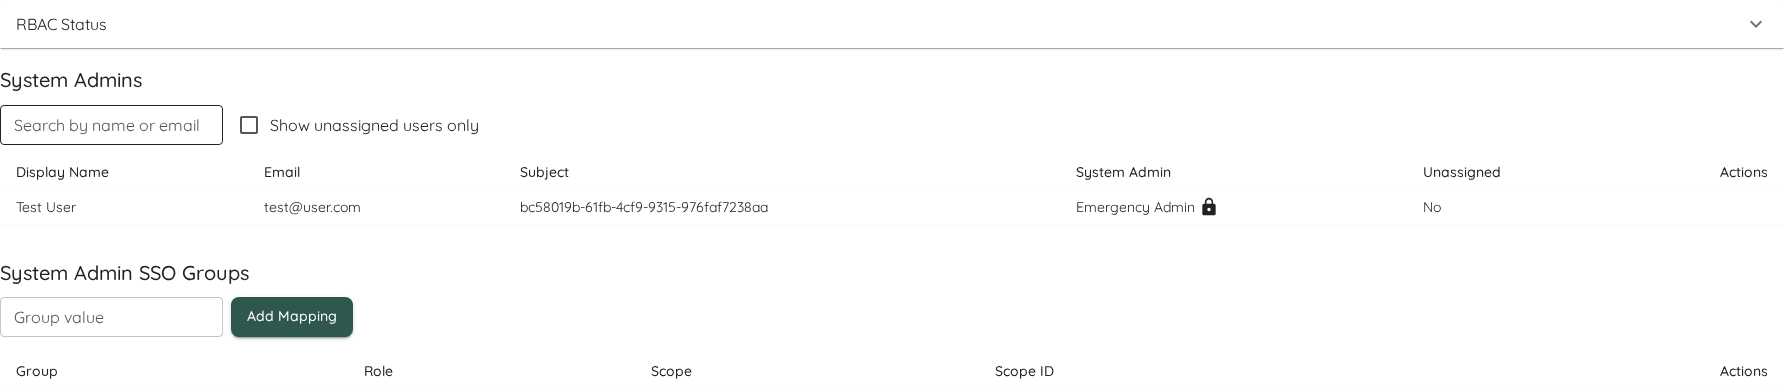
The full role matrix, bootstrap walkthrough, group-mapping guide, and troubleshooting steps are documented under System Settings → Role-Based Access Control. The Authentication page now links across to it.
API Keys with Scopes
API Keys — introduced in v26.5.3.5 for CLI and MCP scenarios — can now be scoped.
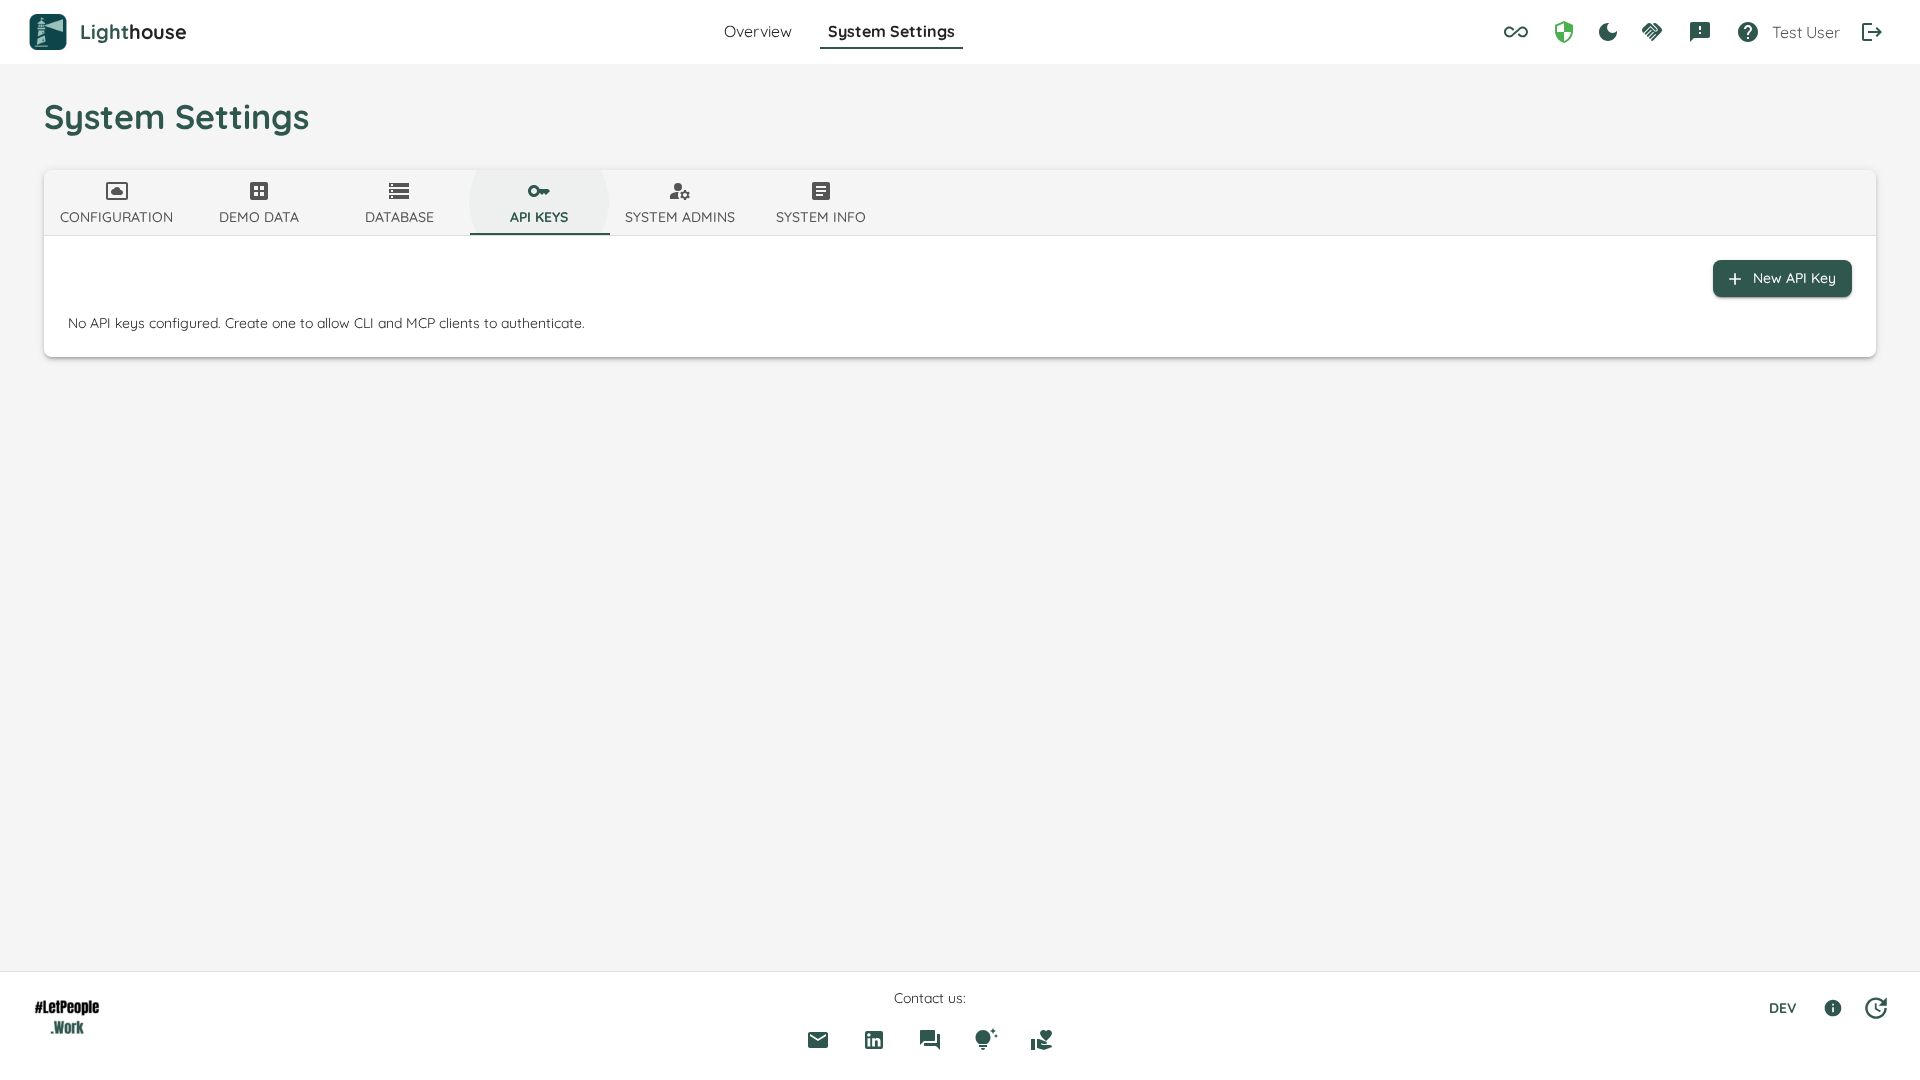
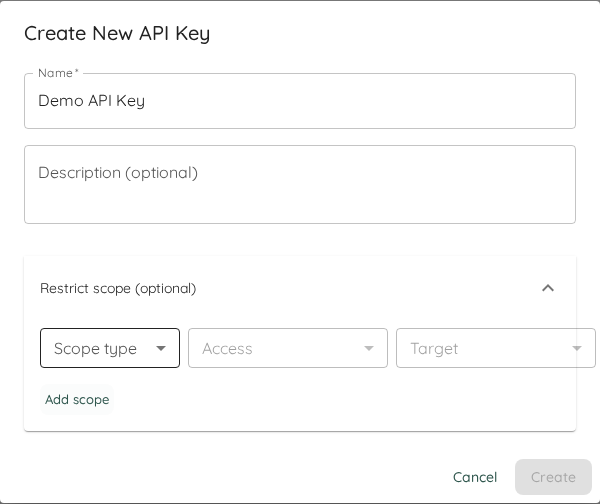
The create dialog now includes a guided scope-row builder so you can compose Team and Portfolio scopes without hand-crafting strings, and API keys inherit the owner's SSO group claims at issuance time so RBAC behaves identically whether you call Lighthouse from the browser or with a key.
Bugfixes and Improvements
- Connection-list visibility for scoped admins — Team Admin and Portfolio Admin can now read the list of work-tracking-system connections, which is needed for the Edit-Settings tab on their assigned team or portfolio to load. Secret option values remain redacted at the DTO layer; only System Admin can create, edit, or delete connections.
- Manual Delivery date updates — editing the Delivery date on a Manual Delivery sometimes appeared to do nothing: the forecast updated but the displayed date stayed put. Root cause was a timezone shift on westward zones; delivery dates now render in UTC and reflect changes immediately.
- Updated various third-party libraries.
Contributions ❤️
Special thanks to everyone who contributed feedback for this release:
Lighthouse v26.5.3.5
0a52b58
huserben
Benjamin Huser-Berta
Support for new Lighthouse Clients
This release introduces a new set of external Lighthouse clients for automation and AI-assisted workflows.
You can now use Lighthouse through:
- a dedicated CLI for terminal workflows, scripts, and CI
- a local MCP stdio server for tools such as VS Code / GitHub Copilot and similar local MCP clients
- a shared MCP HTTP server for hosted or team-wide AI integrations
To support these non-browser clients, Lighthouse now also supports API Keys for authenticated CLI and MCP usage.
For setup details, examples, and download options, see the live documentation:
Bugfixes and Improvements
- For various charts, the dates in the x-axis were unreadable for larger time horizons. This should be fixed now.
- Adjusted the RAG calculation for the Feature Sizes in the portfolio to give more clear signals
- Updated various third-party Libraries
Contributions ❤️
Special thanks to everyone who contributed feedback for this release:
Lighthouse v26.4.25.4
8829161
huserben
Benjamin Huser-Berta
Load Balance Matrix
This release introduces the Load Balance Matrix (LB-Matrix):
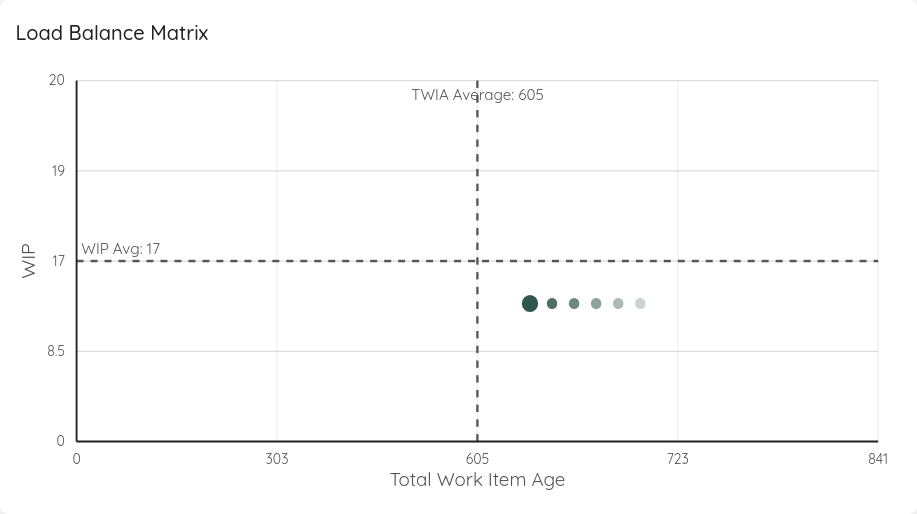
It is based on our blog post Limit Work in Progress without Work In Progress Limits and can be used to control your WIP.
It is available under Flow Metrics in your Team and Portfolio Metrics section and comes with a fully implemented RAG system to help you better control WIP with concrete proposals.
Default Size Tweak
If we use Override States for the default size of features, we used the default size no matter what. However, there may be cases where we started to break down a Feature into work items, and the count is already exceeding the default size. This meant, we use a lower value for our forecasts although we already knew that it will be most likely more work.
The new behaviour is, that in such a case, we're taking the actual work item cound instead of the default size. This will lead to more realistic forecasts.
This Feature was proposed through our new Product Idea Board
REST API Versioning
The REST API is now available with specific versions, to make sure you have more stable endpoints if you are using a script or other client that works against the Lighthouse REST API.
You can reach the API right now through /api/v1/ and we will introduce new versions whenever there is a breaking api change.
Bugfixes and Improvements
- Issue with showing Dates and States in Cycle Time Scatterplot, Work Item Aging Chart, and Simplified CFD are now fixed
- Updated various third-party Libraries
Contributions ❤️
Special thanks to everyone who contributed feedback for this release:
Lighthouse v26.4.19.10
bfd2c02
huserben
Benjamin Huser-Berta
Metrics Improvements
We've worked on the feedback we got from the UX overhaul, and refined our Metrics further. Following changes were made in this release.
Simplified Metrics Categories
The available categories in the Metrics section have been consolidated from six categories to four:
- Flow Overview --> Flow Overview (unchanged)
- Cycle Time --> Merged into Flow Metrics
- Throughput --> Merged into Flow Metrics
- WIP & Aging --> Merged into Flow Metrics
- Predictability --> Predictability (unchanged)
- Portfolio & Features --> Portfolio & Features (unchanged)
Each chart is now appearing exactly in one category. While the Flow Overview will show you the status at a quick glance, the Flow Metrics will allow you to dive deeper and get into details.
Arrivals Run Chart and Process Behaviour Chart
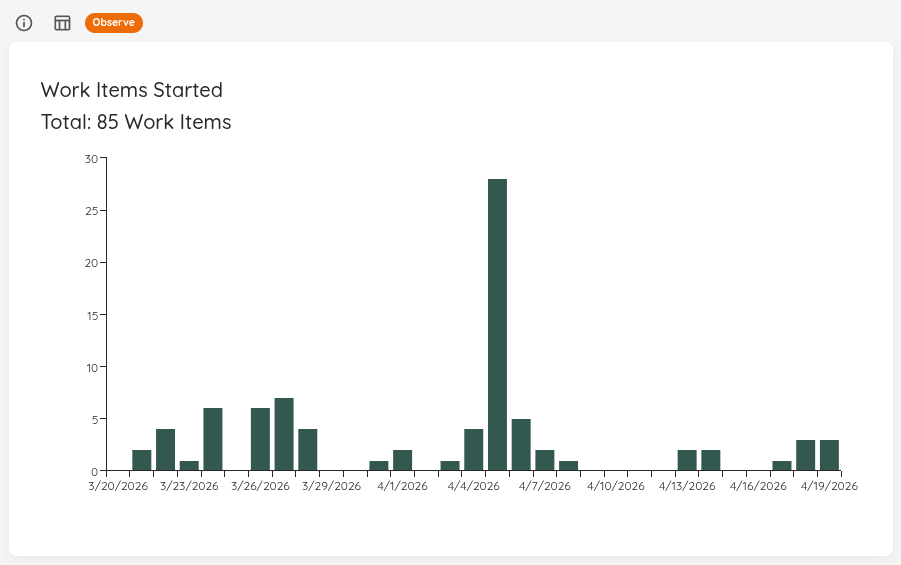
The Metrics Dashboard now includes Arrivals as a first-class metric for both Teams and Portfolios:
- Arrivals Run Chart: Shows the daily count of work items started over the selected date range. Complements the Throughput Run Chart by visualizing the intake side of flow.
- Arrivals Process Behaviour Chart: Applies XmR-chart analysis to the arrival rate, highlighting special-cause variation in how many items enter the system per day.
The Run Chart is part of the Flow Metrics category, while the PBC can be found in the Predictability category alongside the other PBCs.
The Arrivals Run Chart includes a two-factor status indicator that checks both arrivals-versus-departures balance and whether arrivals are continuous or batched.
Total Throughput and Total Arrivals Info Widgets
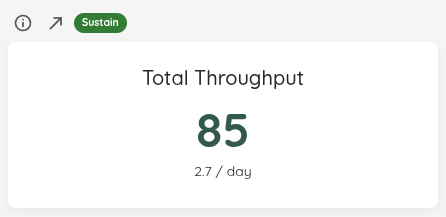
To give a decent overview, both the Throughput as well as your arrivles (items you've started) are now visualized in an individual Metric on the Flow Overview page.
Removal of Started vs. Closed Widget
As we have an individual widget for Total Throughput and Total Arrivals, this widget was obsolete and was removed.
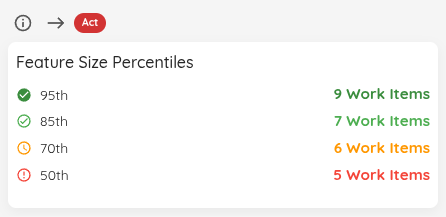
Feature Size Percentiles
For Portfolios, you can now also see in the Flow Overview page a summary of your Feature Sizes (similar to the Cycle Time Scatterplot). This allows you to see how big your features are at a quick glance.
Trend Indicators
All Flow Overview info widgets now display trend indicators comparing the current date range to a prior period:
- WIP Overview, Features Worked On (Teams), and Total Work Item Age compare snapshot values at the start and end of the selected range.
- Predictability Score, Cycle Time Percentiles, Total Throughput, Total Arrivals, and Feature Size Percentiles compare the current period against an equal-length window immediately before the start date.
- Percentile tooltip rows now use a
previous → **current**format with the current-period value emphasized.
The trends are neutral, and simply indicate whether you things are increasing or decreasing compared to a previous period.
Time Filter for Widgets
While previously the WIP Overview, Features Worked On, and Total Work Item Age were simply ignoring any time selected, and showed the current state, they will now resolve their values as of the selected end date. Changing the date range will change the displayed counts to reflect the system at that point in time.
Note: The Blocked Items widget does not support this (yet)
Other Metrics Improvements
Apart from the above, the following things related to metrics were improved:
- The Predictability Score was adjusted to give more accurate results. Previously, with an increase of the input, the score had a tendency to be too optimistic
- Removed the Info icon when a baseline was missing in the PBCs - it will be reflected in the RAG status instead
- The Control Limits as well as the Average Lines for PBCs are now rounded to not have any decimals
- Total Work Item Age over Time RAG status was showing the wrong values
Redesigned Team Forecast
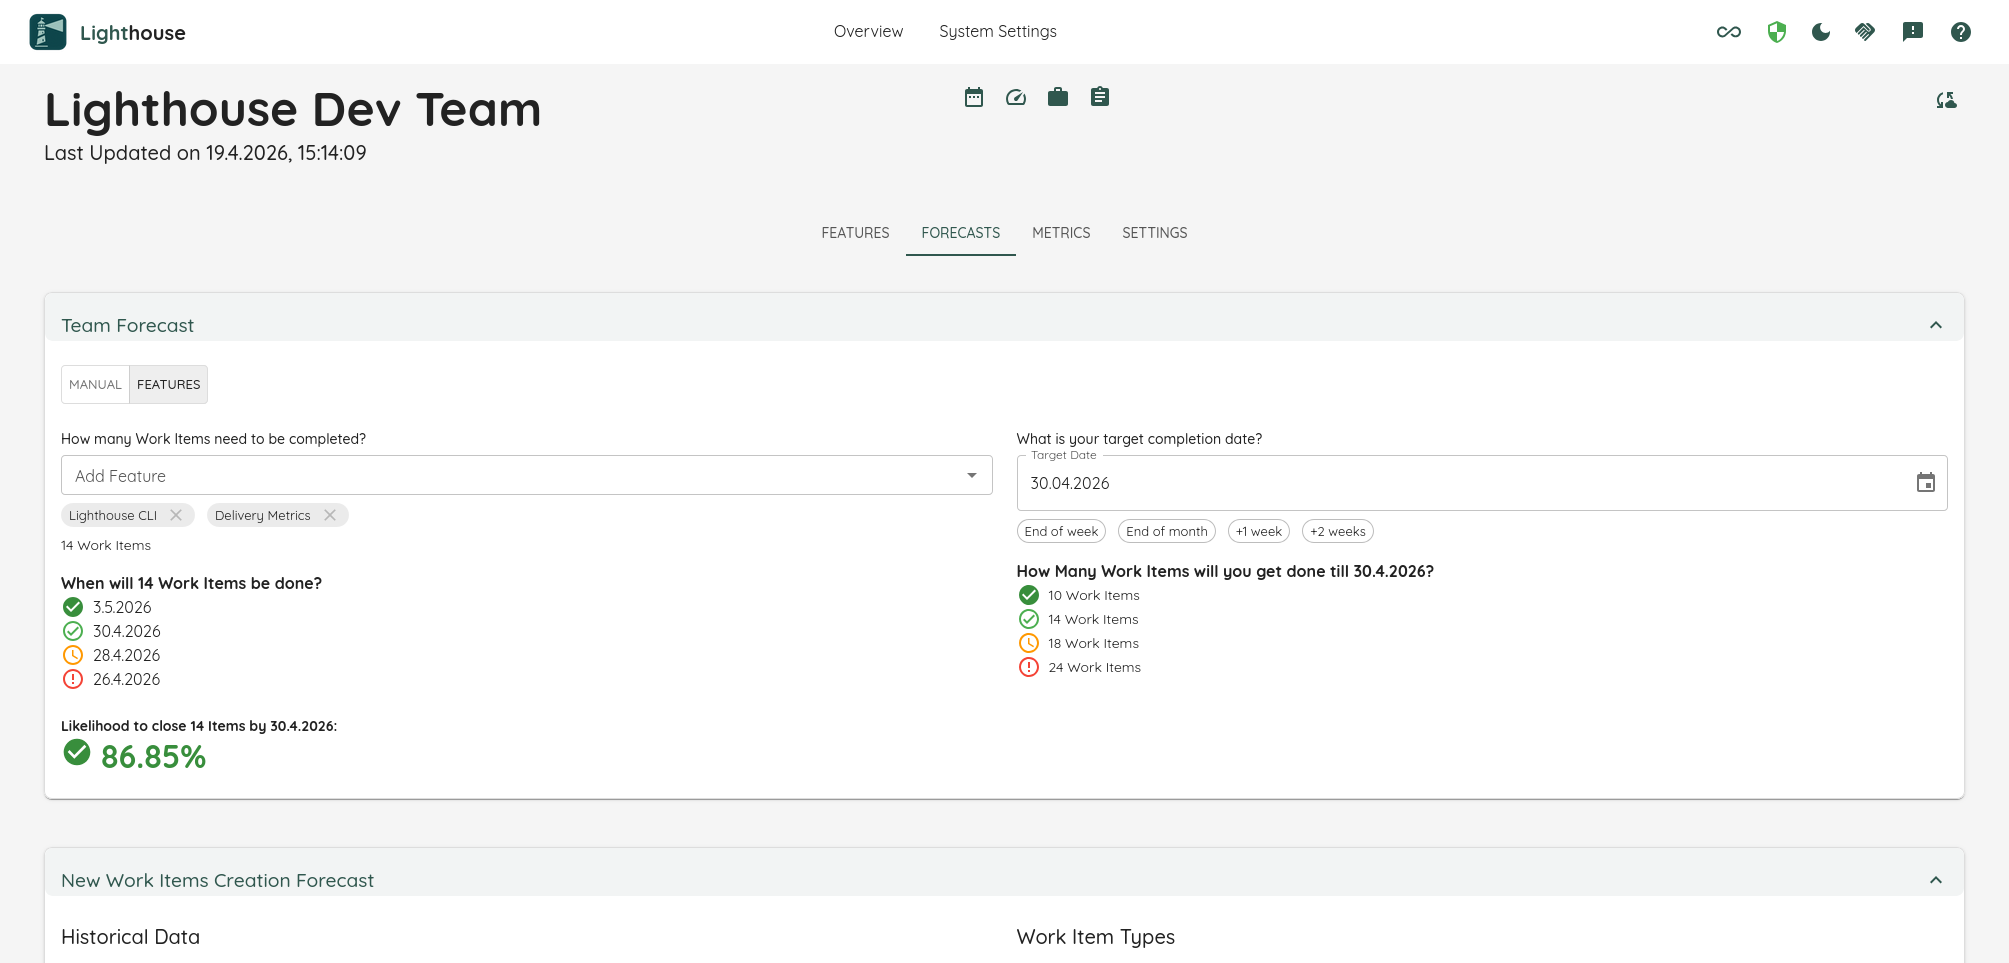
The Team Forecast has been redesigned to make forecasting faster and more intuitive:
- Auto-run forecast: The forecast now runs automatically as you type — no more "Forecast" button.
- Smart quick-pick chips: Select your remaining work directly from contextual suggestions. WIP and Backlog counts are pulled automatically from your team's current state so you can pick a sensible starting point with one click.
- Feature Selection: Switch to Feature Mode and select Features from your backlog. It will automatically use the remaining work of all selected Features to run the forecast.
- Date shortcuts: Choose common target dates instantly — End of week, End of month, +1 week, or +2 weeks — without opening the date picker.
Bug Fixes and Other Improvements
- Product Board: Various references to the newly introduced Product Board were added
- Load all Azure DevOps Boards: Previously only the first 100 boards on any Azure DevOps Projects were shown. Now all boards are loaded.
- Show Work Items for Features in Delivery: You can now, similar to the Team and Portfolio Feature view, see what Work Items belong to a feature when expanding the Delivery View
- Update Manual Deliveries: Fixed issue that prevented any update to a delivery that used manual feature selection mode
Contributions ❤️
Special thanks to everyone who contributed feedback for this release:
Lighthouse v26.4.7.1
3e05b5e
huserben
Benjamin Huser-Berta
Simplified Onboarding
Getting started with Lighthouse is now faster and more guided. The creation flow for Work Tracking Systems, Teams, and Portfolios has been redesigned as a focused step-by-step process — surfacing only what you need to get connected, and deferring advanced settings to the edit view.
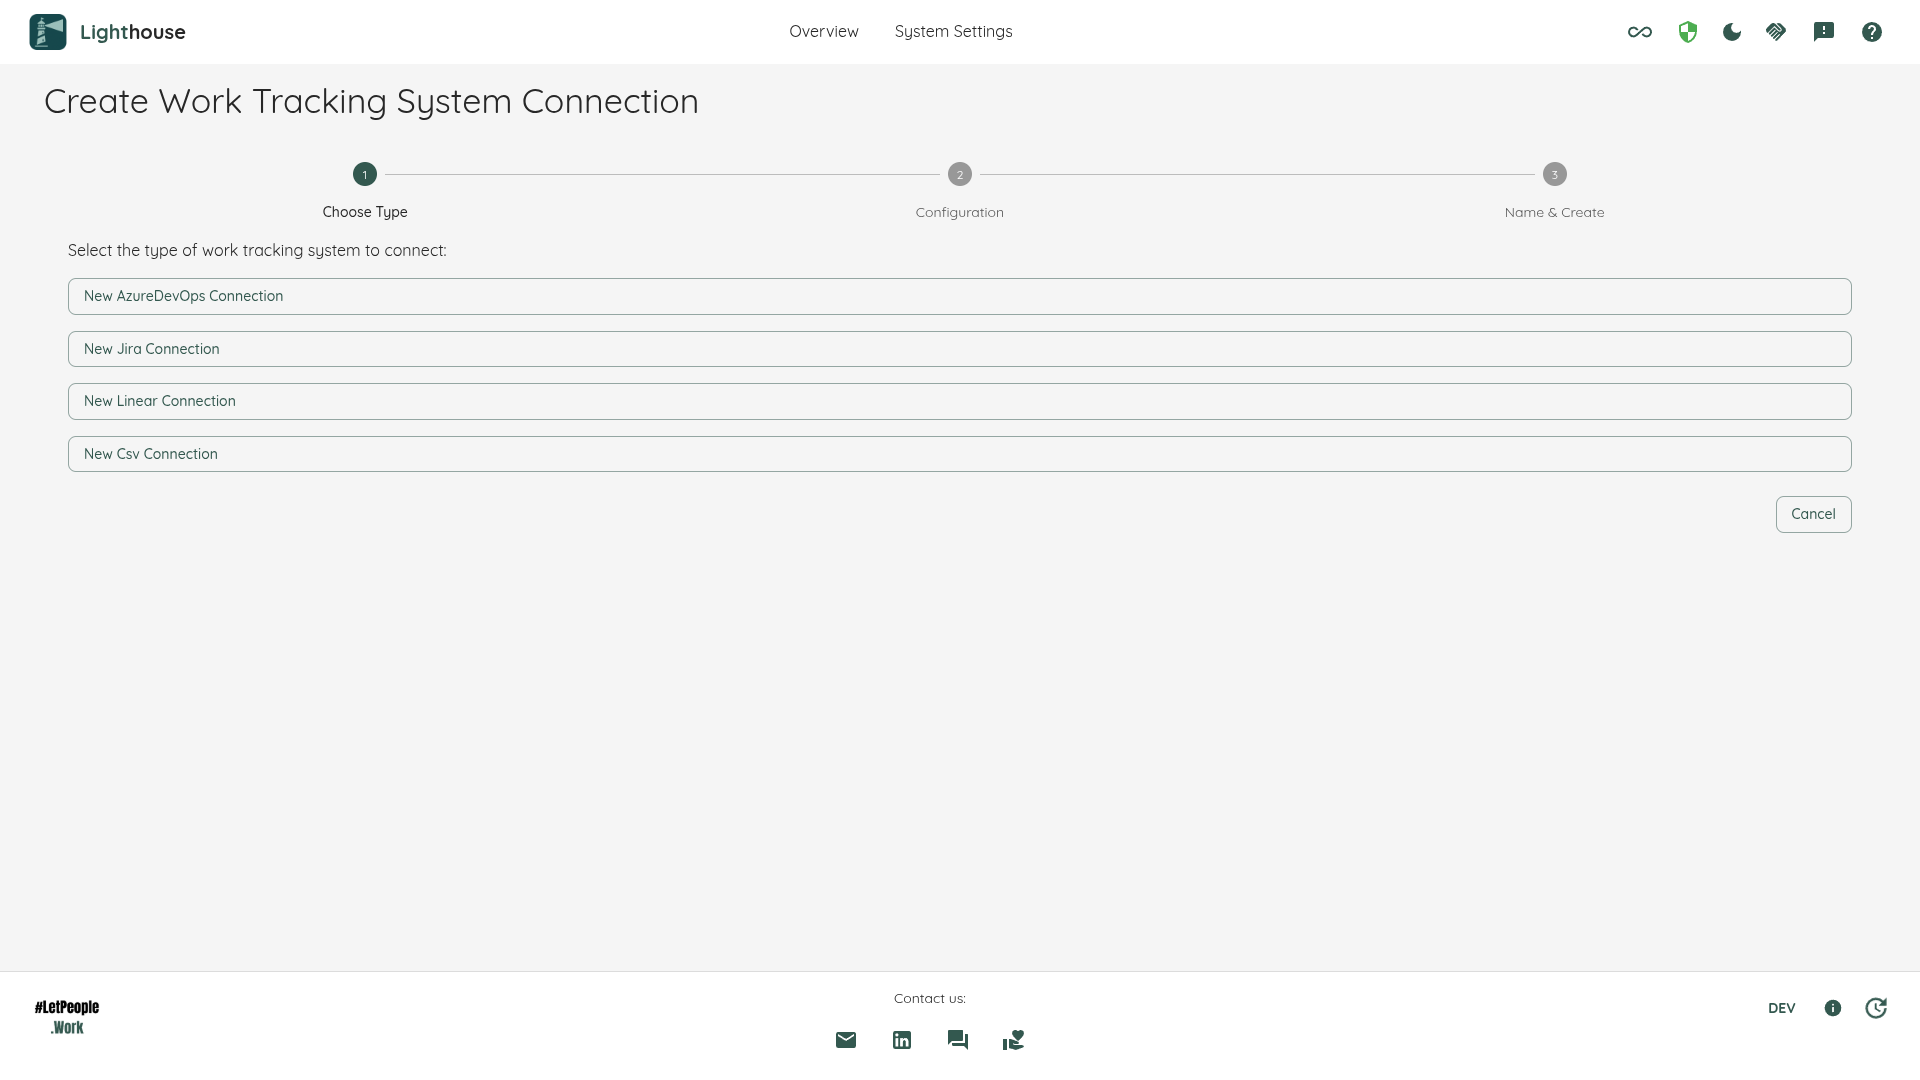
Key changes:
- Connection type first: Choose your provider before filling in any fields. Each authentication method now includes a short description so you know which one to pick.
- Validate on create: The separate Validate button is gone. Lighthouse now validates your connection automatically when you press Create and reports specifically what went wrong if it fails.
- Improved error messages: When a connection fails validation, Lighthouse tells you why — whether the URL is unreachable, the credentials are rejected, or a referenced additional field is invalid.
- Guided Team and Portfolio flows: After picking a connection and entering a name, the wizard walks you through data retrieval, work item types, and states in sequence — and offers to create immediately once enough information is ready.
Advanced options (additional fields, sync settings, state mappings) remain fully accessible after creation in the edit view.
Metrics Dashboard Overhaulded
The Metrics Dashboard has been significantly redesigned to make it easier to navigate and interpret your flow data at a glance.
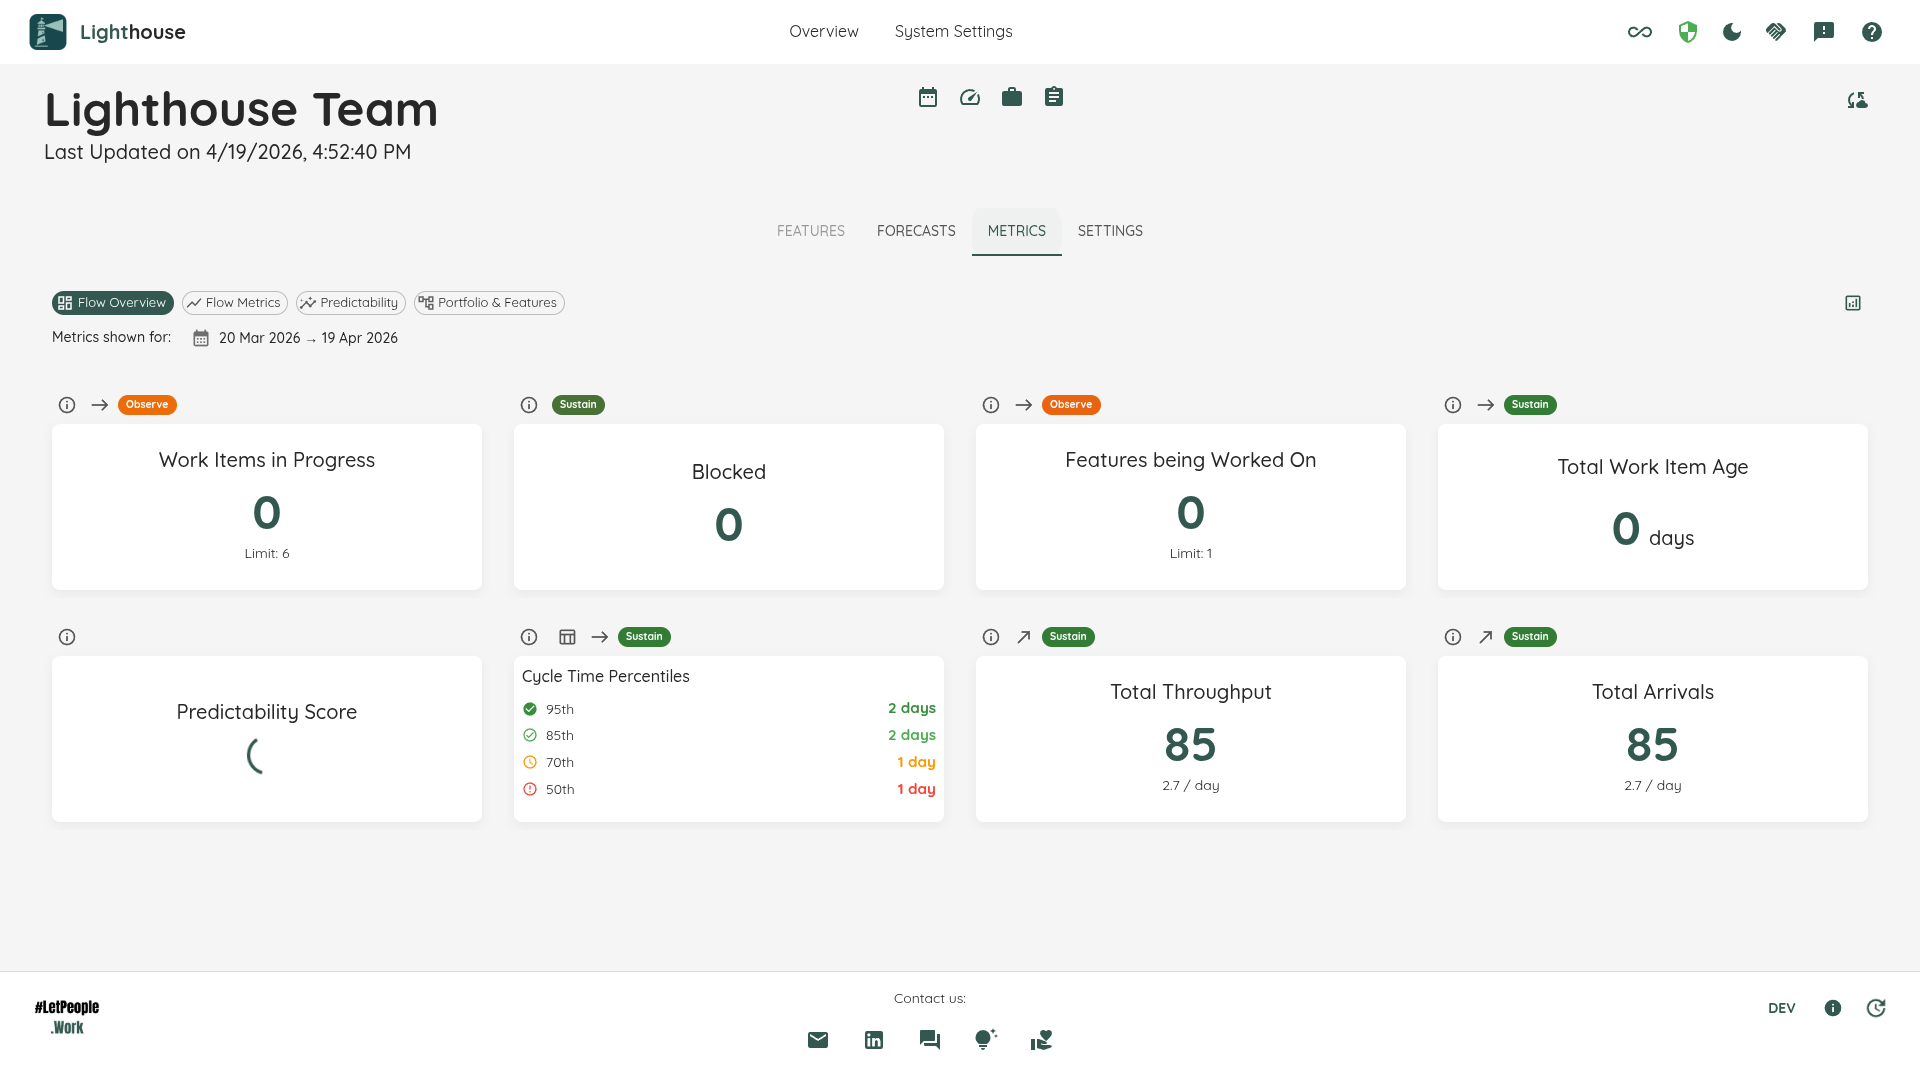
Redesigned Dashboard Categories
The Metrics Dashboard now organizes widgets into six focused categories, each answering a specific question about your delivery system:
| Category | Question |
|---|---|
| Flow Overview | How is my system doing at a glance? |
| Cycle Time | How long do items take? |
| Throughput | How much are we delivering? |
| WIP & Aging | Where is work getting stuck? |
| Predictability | Can we trust our forecasts? |
| Portfolio & Features | How do features flow through the system? |
Each category chip now displays an icon and shows a tooltip on hover explaining what the category helps you understand.
Widget Header
Widgets now feature improved header actions:
- Info button (ℹ️): Click the info icon on any widget to see a brief description of what the widget shows and a Learn More link to the full documentation.
- View Data button (📊): Click the table icon on any widget to open a dialog showing all of the work items that feed that widget. This replaces the previous click-anywhere-on-the-card behavior for the Cycle Time Percentiles and Started vs. Closed widgets — those widgets no longer open a full-dataset dialog on card click. Charts that support context-specific drill-ins (e.g. clicking a single bar, bubble, or data point) continue to work as before.
- Inline RAG chip: Hover over the chip to see the actionable guidance tip.
RAG Status Indicators
Every widget on the Metrics Dashboard shows a Red / Amber / Green (RAG) status indicator. RAG status is computed from live data and your team's configuration (SLE, System WIP Limit, Feature WIP, blocked indicators, etc.) so you can spot issues at a glance without interpreting each chart individually.
How it works:
- Red = action required (missing configuration, threshold exceeded, or process signal).
- Amber = attention needed (approaching limits or moderate changes).
- Green = within healthy operating range.
- Toggle the Show Tips button in the dashboard header to show or hide the RAG chips.
Other UX Improvements
Improved State Mapping UX
Configuring state mappings on teams and portfolios is now significantly more intuitive:
- Source states are picked from Doing: You can only select states that are currently in the Doing list — no freeform typing required.
- Auto-sync with Doing: Adding a mapping automatically replaces the included states in your Doing list with the new mapping name. Removing the mapping restores the original states.
- No duplicates: A state can only belong to one mapping at a time, keeping your configuration clean.
A reminder is shown after saving to indicate that a data refresh is needed for changes to take effect.
Feature Progress Bar Simplified
On the Feature List, if a feature is tracked by only a single team, Lighthouse now shows a single progress bar instead of displaying both a team bar and an identical total bar. This removes redundant information and makes the list easier to read at a glance.
More Specific Validation Messages
When a connection fails validation, Lighthouse now reports specifically what went wrong — whether the URL is wrong, credentials are invalid, or there is a problem with a referenced additional field. This makes it easier to identify and fix issues without guessing.
Settings No Longer Reload Unexpectedly
Settings pages no longer reload while you are actively editing them due to background data updates. Your in-progress changes are preserved while the app continues to refresh data in the background.
Automatic Browser Cache Invalidation
When a new version of Lighthouse is deployed, browsers now automatically load the updated interface instead of serving a stale cached version. No manual hard-refresh is needed after an update.
⚠️ Breaking Change: Tags Removed from Teams and Portfolios
The Tags field has been removed from Team and Portfolio configuration. If you previously used tags to organise or filter your teams and portfolios, this capability is no longer available.
Open-Source Software (OSS) Attribution
The System Info page in System Settings now includes an OSS Attribution section listing all open-source components bundled with Lighthouse, along with their versions and licenses. This makes it straightforward to review every third-party dependency that Lighthouse ships with.
Bug Fixes and Other Improvements
- Standalone real-time updates fixed: The SignalR connection in the Standalone (desktop) edition was broken, preventing live updates from appearing in the UI without a manual page reload. This has been fixed.
- Write-back with duplicate work items: When a work item appeared multiple times across queries, write-back would fail. Lighthouse now handles duplicates correctly.
- Updated various third-party dependencies.
Contributions ❤️
Special thanks to everyone who contributed feedback for this release:
Lighthouse v26.3.28.14
eb10ccf
huserben
Benjamin Huser-Berta
Authentication Support
Lighthouse now supports OpenID Connect (OIDC) authentication to protect your instance. When enabled, users must sign in through your identity provider before accessing Lighthouse — unauthenticated requests are redirected to the sign-in screen.
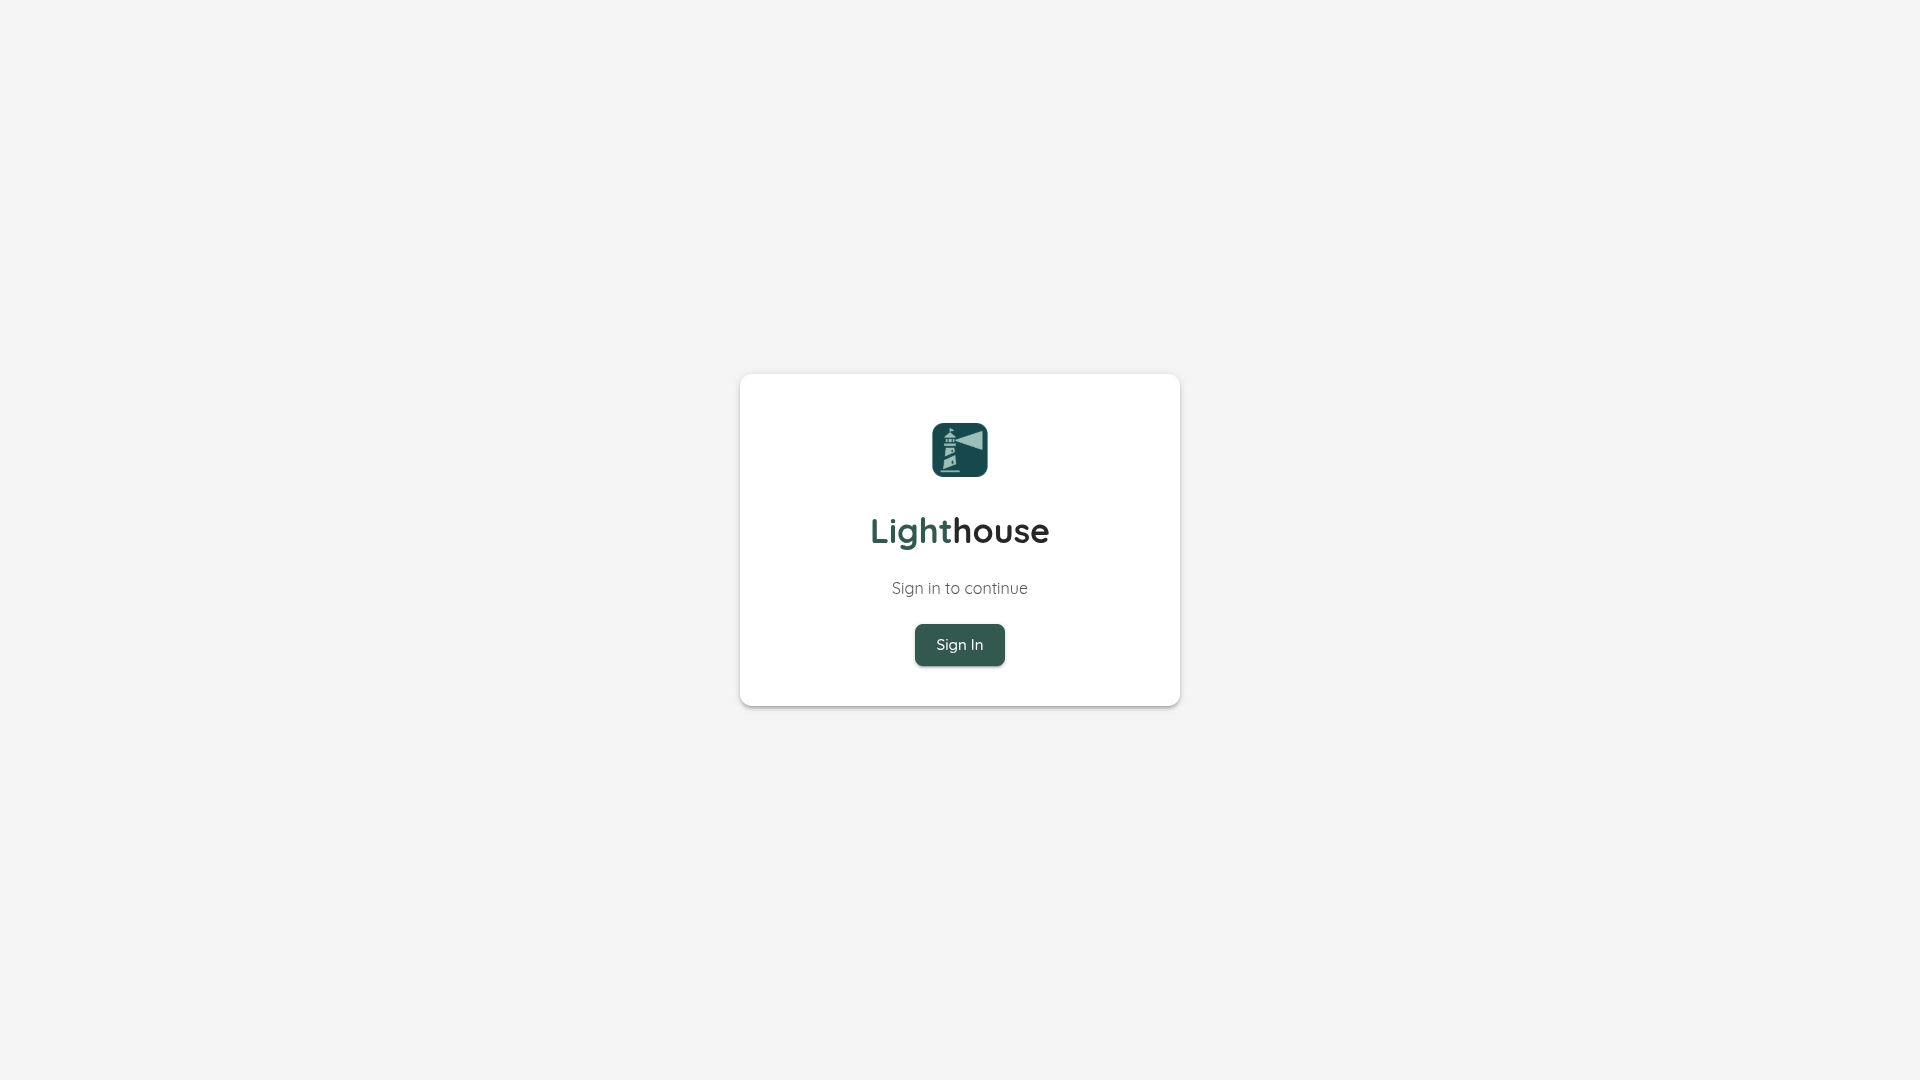
Key highlights:
- Fail-closed design: If authentication is enabled but misconfigured (e.g. no
Authorityset), Lighthouse displays an error screen and refuses to start, rather than accidentally leaving the app unprotected. - Session management: Sessions last 8 hours by default, configurable via
SessionLifetimeMinutes. Users see a Session Expired screen when their session ends. - Provider guides are available for Keycloak, Microsoft Entra ID, Google, and Auth0.
See the Authentication documentation for the full configuration reference and setup instructions.
Note: Authentication is a Premium feature. A valid Premium license is required to use it.
Linear Integration — Production Release
The Linear integration has moved from preview to a fully supported production provider. If you were using Linear during the preview phase, you will need to reconfigure your teams and portfolios. While we are not supporting 100% the same features as with Jira and Azure DevOps yet (for example, additional fields are not yet available), the basic functionality now works.
Here is what changed:
Teams: Linear teams are now configured using a team selection wizard instead of typing team names manually. The wizard lists all available teams from your connected Linear workspace. Work item types are fixed to Issue and do not require manual configuration.
Portfolios: Linear portfolios automatically retrieve all projects in the authenticated workspace as Lighthouse features. No query or work item type configuration is needed. Just create a portfolio with a Linear connection, configure your states, and you're ready to go.
Hierarchy: Lighthouse now maps the full Linear hierarchy:
- Issues (team work items) roll up to Projects (portfolio features)
- Projects roll up to Initiatives (parent features)
This means your Monte Carlo forecasts and metrics correctly reflect the Linear project structure. Initiative names, statuses, and URLs are fetched directly from the Linear API.
See the Linear documentation for updated setup instructions.
State Mappings for Teams and Portfolios
Lighthouse now supports State Mappings — a way to rename or group raw provider states into meaningful Lighthouse states before placing them in To Do, Doing, or Done. If you create a state mapping, it can be used like a regular state, and all the source states will be transformed into the mapped state.
You can use that to:
- Group multiple states into one: For example, group Code Review, QA Review, and Design Review into a single In Review state and place it in Doing.
- Rename a single state: For example, map your provider's In Dev state to Development and then use Development in your Doing list.
How it works:
- Open team or portfolio settings and scroll to the State Mappings section (below the To Do / Doing / Done state lists).
- Add one or more mappings — give each a name and select the source states it should contain.
- Use the mapped name in your To Do, Doing, or Done configuration just like any other state.
Refresh History
In the System Settings, you can now see statistics to the last 30 refreshes that you did for each of your teams and portfolios:
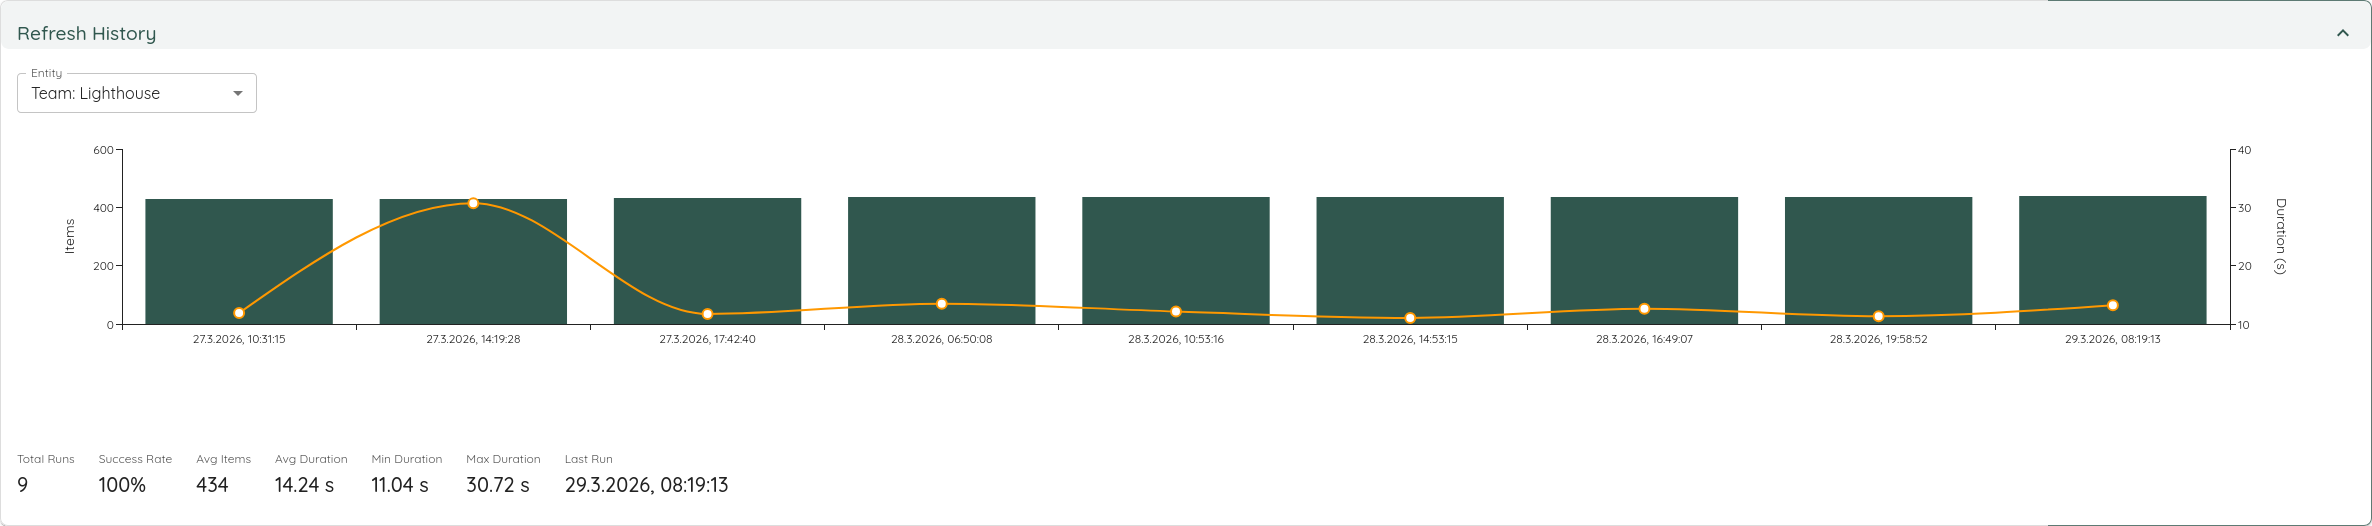
This includes how many items were fetched and how long it took to execute it. This may be useful to track Lighthouse performance over time, to see if it's degrading as you onboard more users, teams, and portfolios or not.
Other Improvements and Bug Fixes
- Cycle Time Dates No Longer Appear in the Future for Positive-Offset Timezones.
- Standalone version will now ensure that all processes are stopped when exiting. This was not the case before, and could prevent updates as files were still in use.
- When running Lighthouse in Docker, the logs were not displayed in the UI, but a generic Logs not found message. This has been addressed, logs show up now.
- Updated various third party dependencies
Contributions ❤️
Special thanks to everyone who contributed feedback for this release:
Lighthouse v26.3.25.6
baf1152
huserben
Benjamin Huser-Berta
Blackout Periods
Lighthouse now supports Blackout Periods — a way to mark specific dates or date ranges as non-working days directly in your configuration. Common use cases include public holidays, company off-days, or any planned period where your team is not delivering work.
Blackout periods affect Lighthouse in two key areas:
Forecasting: When running a Monte Carlo Simulation, Lighthouse skips blackout days entirely. The simulation does not count those days as working days and does not sample throughput for them. This means your forecasts automatically account for known non-working periods — no manual throughput adjustment or buffer needed.
Metrics charts: Blackout days are highlighted with a hatched overlay in the following charts, so you can immediately tell why throughput was zero or WIP dipped on those days:
- Throughput Run Chart
- WIP Over Time
- Total Work Item Age Run Chart
- Process Behaviour Charts (all variants)
- Cycle Time Scatterplot
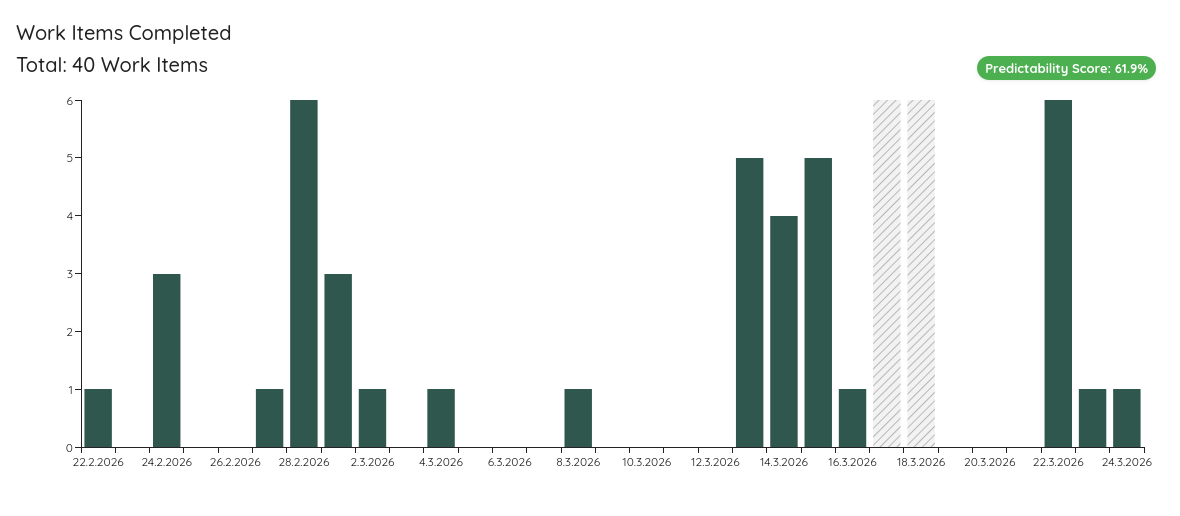
Blackout periods are configured globally in System Settings → Configuration → Blackout Periods and apply to all teams and portfolios. See the Configuration documentation for details.

Database Management
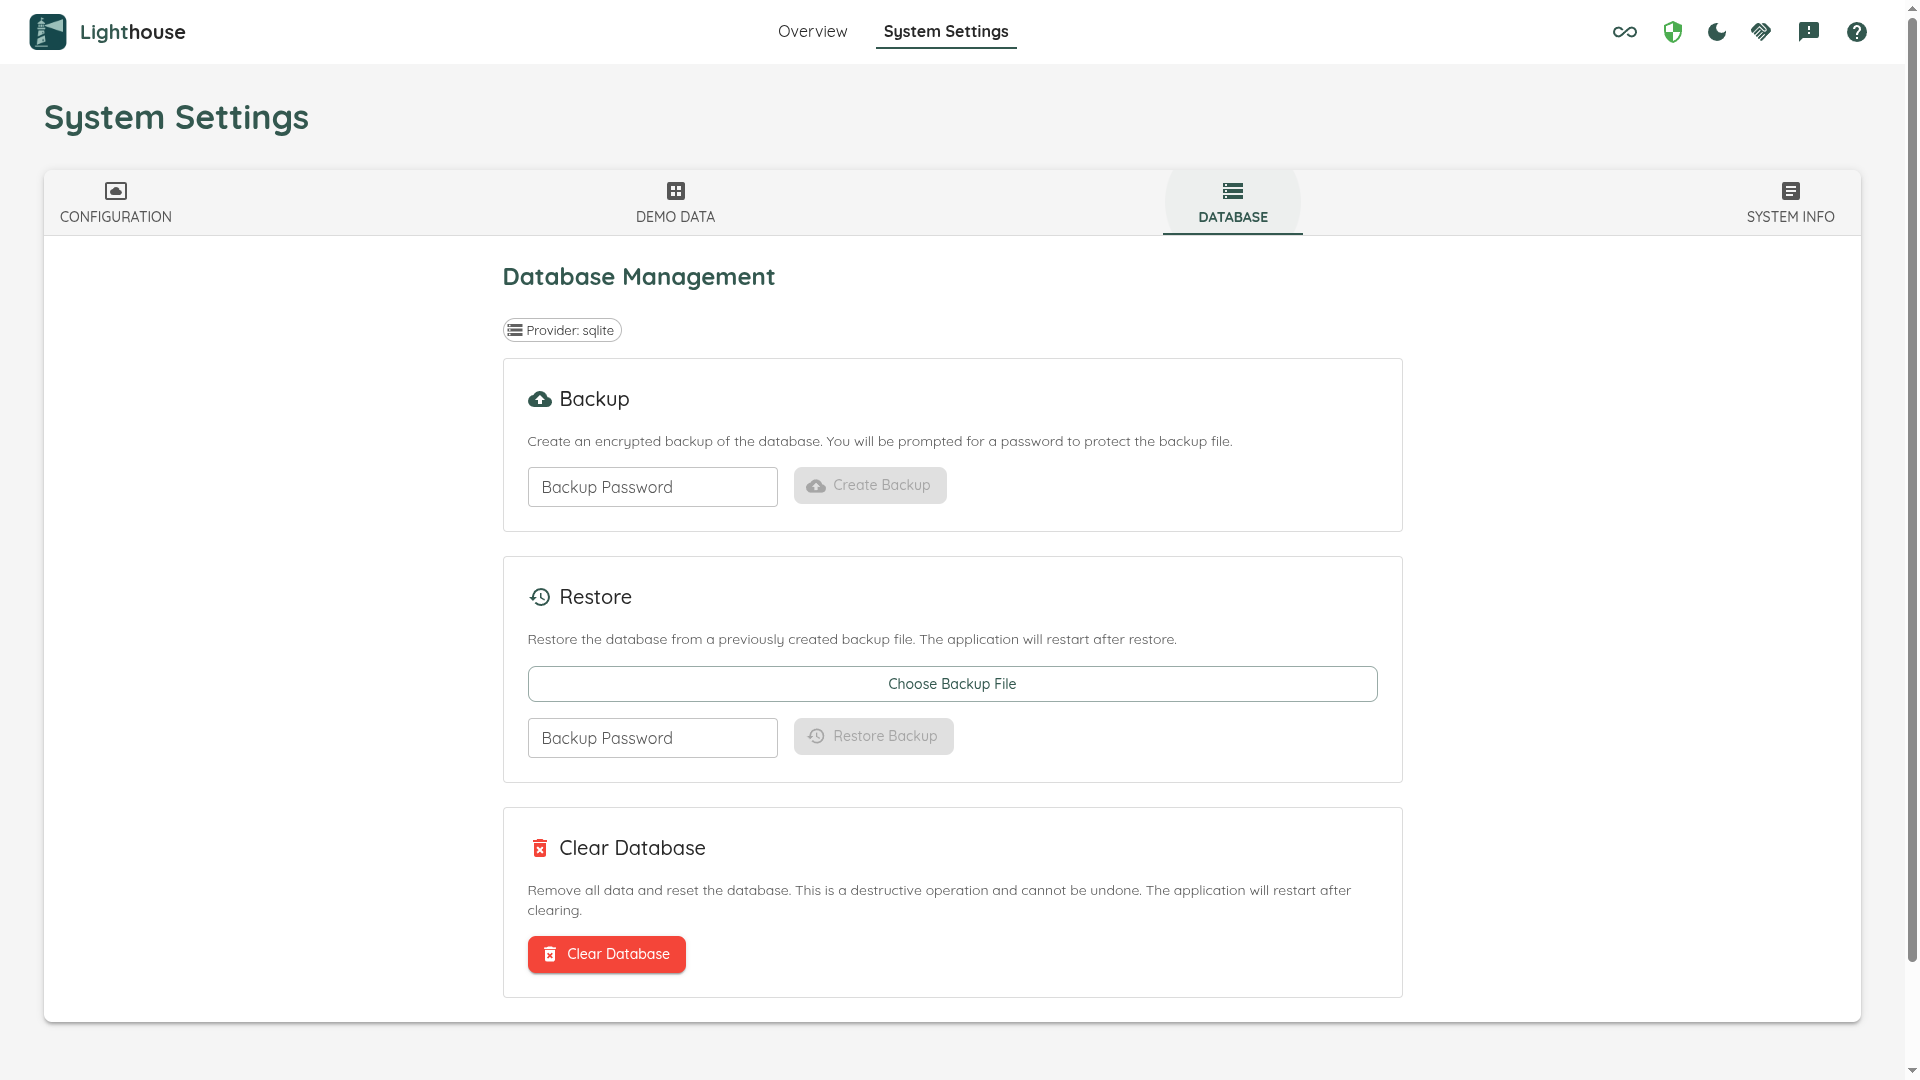
Lighthouse now includes built-in Database Management capabilities, available under System Settings → Database Management. You can create encrypted backups of your database, restore from a previous backup, or clear all data — directly from the UI.
Key capabilities:
- Backup: Creates an AES-encrypted ZIP archive of your database. The backup is password-protected using PBKDF2 key derivation (SHA-256, 100 000 iterations). Downloads are available as a single file.
- Restore: Upload a previously created backup to replace the current database.
- Clear: Removes all data from the database, giving you a clean slate.
Provider support:
| Provider | Backup format | Requirements |
|---|---|---|
| SQLite | Raw database files | None — works out of the box |
| PostgreSQL | pg_dump / pg_restore |
postgresql-client tools must be installed (included in the official Docker image) |
Operational notes:
- While a database operation is in progress, all other data-modifying operations (team updates, forecasts, etc.) are blocked to prevent data corruption.
- Backup passwords are never stored — keep them in a safe place.
Restructure Feature View
The feature view used to have icon indicators for:
- Using the default size instead of the real number of child items
- Being actively worked on by a team
These icons were part of the Name column, and thus you could not search and/or sort by them. With this release, we introduced dedicated columns for:
- Warnings
- Active Work in Progress
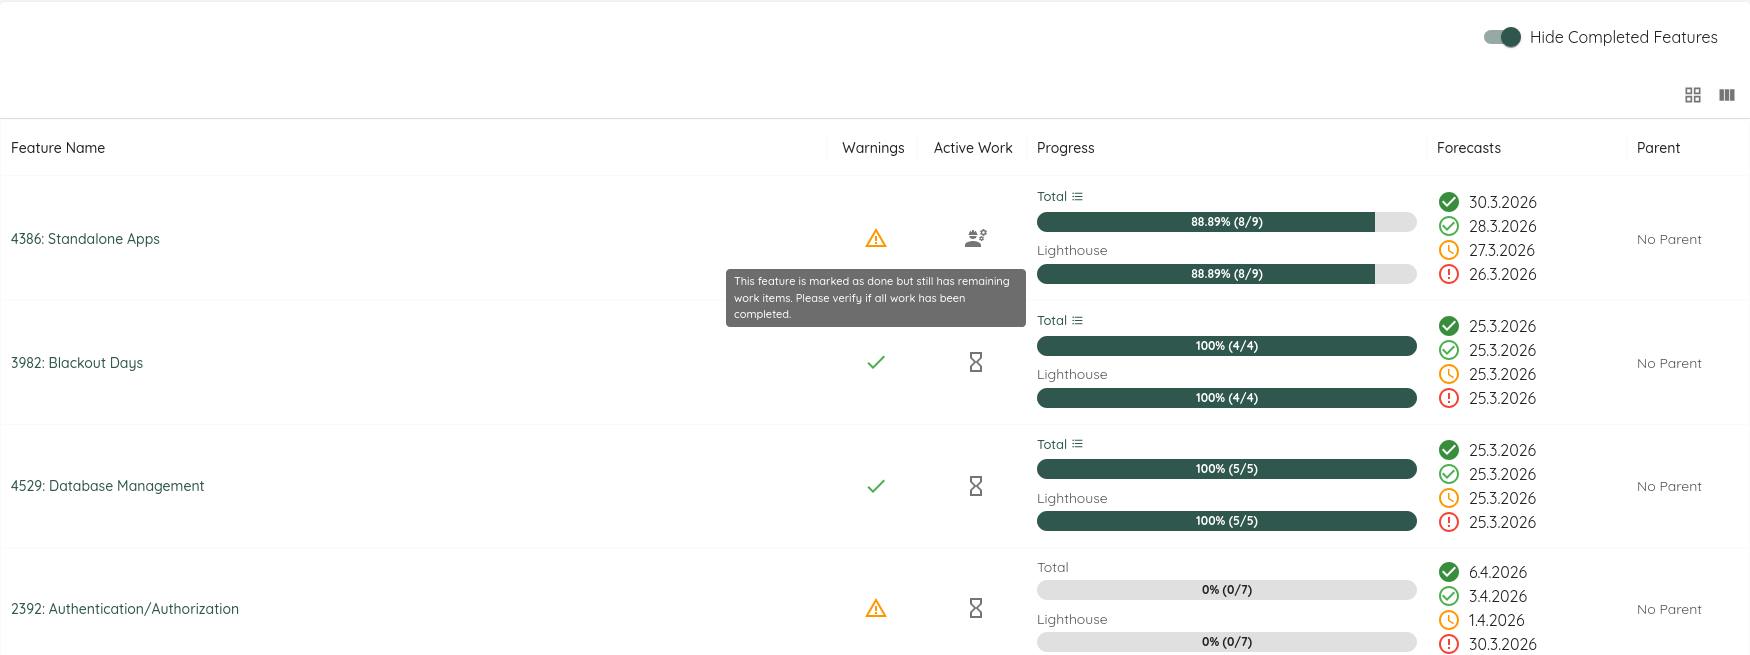
Furthermore, the following change was made to the Hide Completed functionality. Previously, it only filtered by Feature state. So if your Feature was in a done state, it would not be displayed anymore. Now, next to this filter, it also checks the remaining work. If the Feature is in a done state, but has child items that are not done yet, it will still be displayed. Furthermore, in this scenario, we also display a warning (in the new column), as this is an indicator that something is wrong. This is important as having remaining items will impact your forecast, so either the Feature state is wrong, or the child items were not update. The warning is a nudge to get your backlog in order.
Other Improvements and Bug Fixes
- In the previous versions, you could enable the MCP Feature without a license. During startup, it was crashing as it should only be available with a license, effectively logging users out. This is now handled, so that enabling the feature is only allowed with a license, and if you somehow get into the other state anyway, Lighthouse will still manage to start.
- Standalone version will restart after an update has been applied
- Updated various third party dependencies
Contributions ❤️
Special thanks to everyone who contributed feedback for this release:
Lighthouse v26.3.20.4
Standalone Apps
Lighthouse now ships as a native desktop application for Windows, macOS, and Linux — no server setup, no browser, no terminal required.
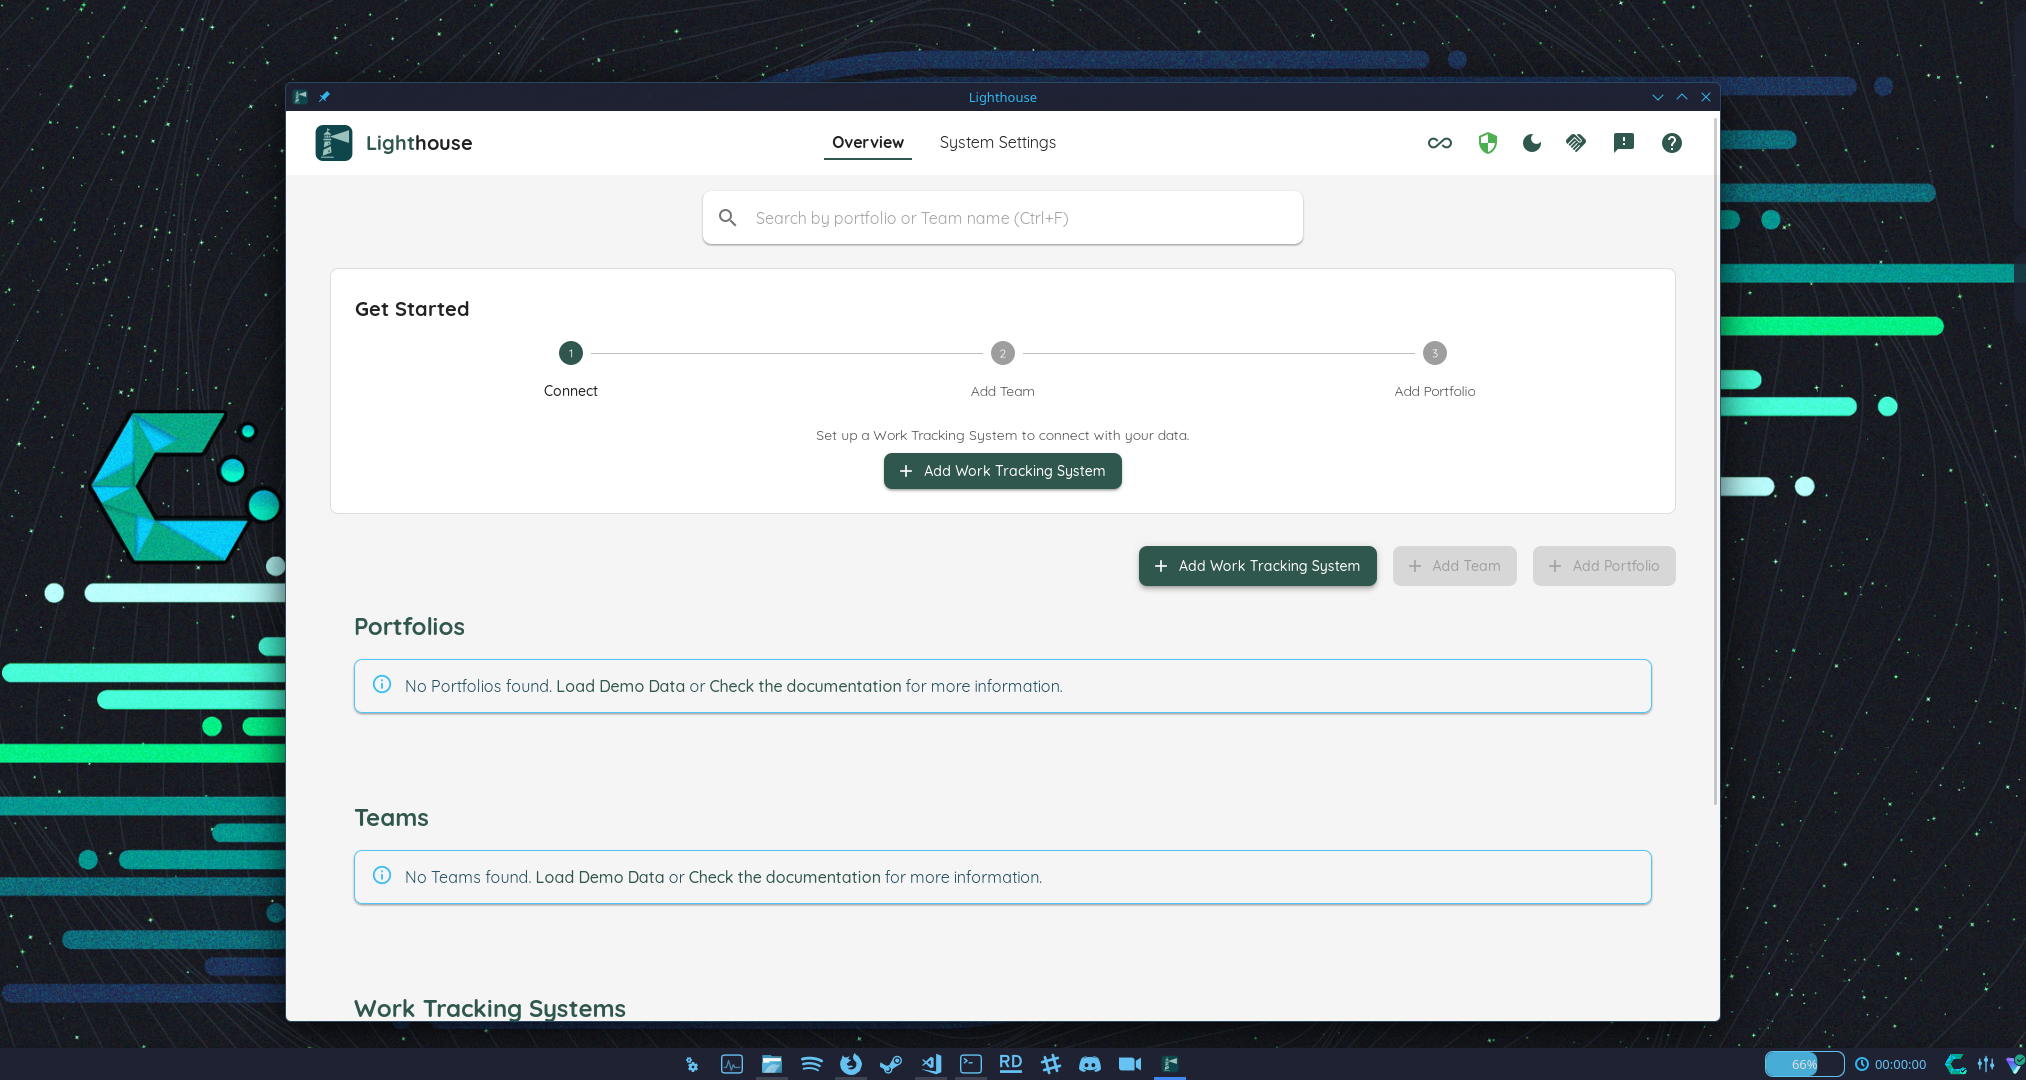
The Standalone edition is ideal for individual users who want a self-contained Lighthouse experience on their own machine. It launches like any other desktop app and manages its own backend automatically.
What's included:
- Full Lighthouse feature set in a native window
- Built-in automatic updater — the app checks for new releases on startup and prompts you before installing
- No network configuration required
Available packages:
| Platform | Package | Notes |
|---|---|---|
| Windows | NSIS Installer (.exe) and MSI Installer (.msi) |
Recommended — installs to Program Files with auto-updater and uninstaller |
| macOS | App Image (.dmg) and App Bundle (.zip) |
Runs natively on both Apple Silicon and Intel; signed, notarized, and auto-updates |
| Linux | AppImage (.AppImage) |
Single-file, runs on most distributions without installation |
For full installation instructions and guidance on choosing between Standalone and Server editions, see the Installation docs.
Scoped Access Token Support for Jira Connections
Lighthouse now supports Scoped Access Tokens as an authentication method for Jira Cloud connections. Unlike regular API tokens — which inherit all permissions of the user who created them — scoped tokens let you grant only the specific permissions Lighthouse needs. This is especially useful in organizations using service accounts, where regular API tokens are not supported.
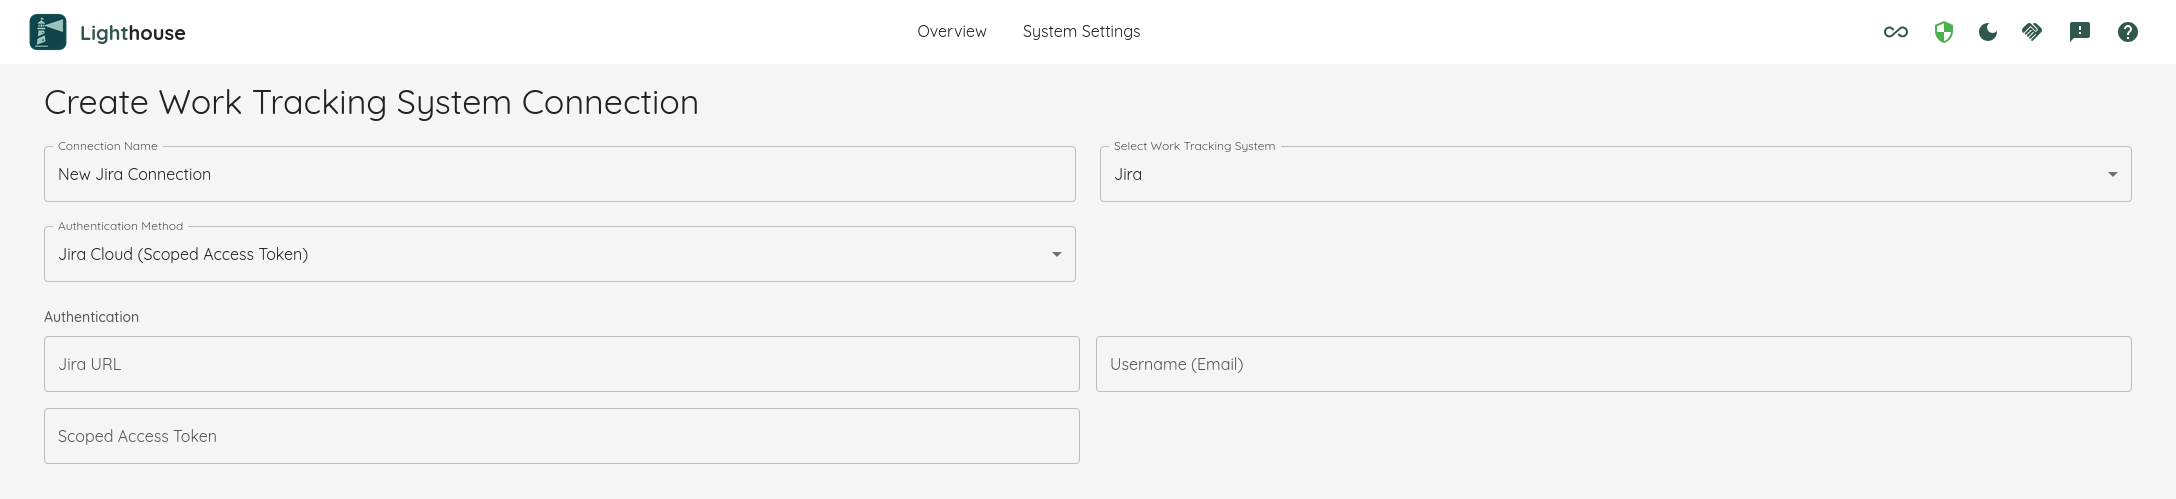
The required scopes for read-only access are read:jira-user and read:jira-work. If you use the Write Back feature, you additionally need write:jira-work.
{: .note}
Due to a Jira restriction, the boards endpoint does not support scoped token authentication. If you are using a scoped token, Lighthouse will show "No Boards available" and the Board Wizard cannot be used. You can either configure your teams and portfolios manually, or use a personal API token for the initial setup and switch to a scoped token afterwards.
For full setup instructions, see the Jira documentation.
System Info
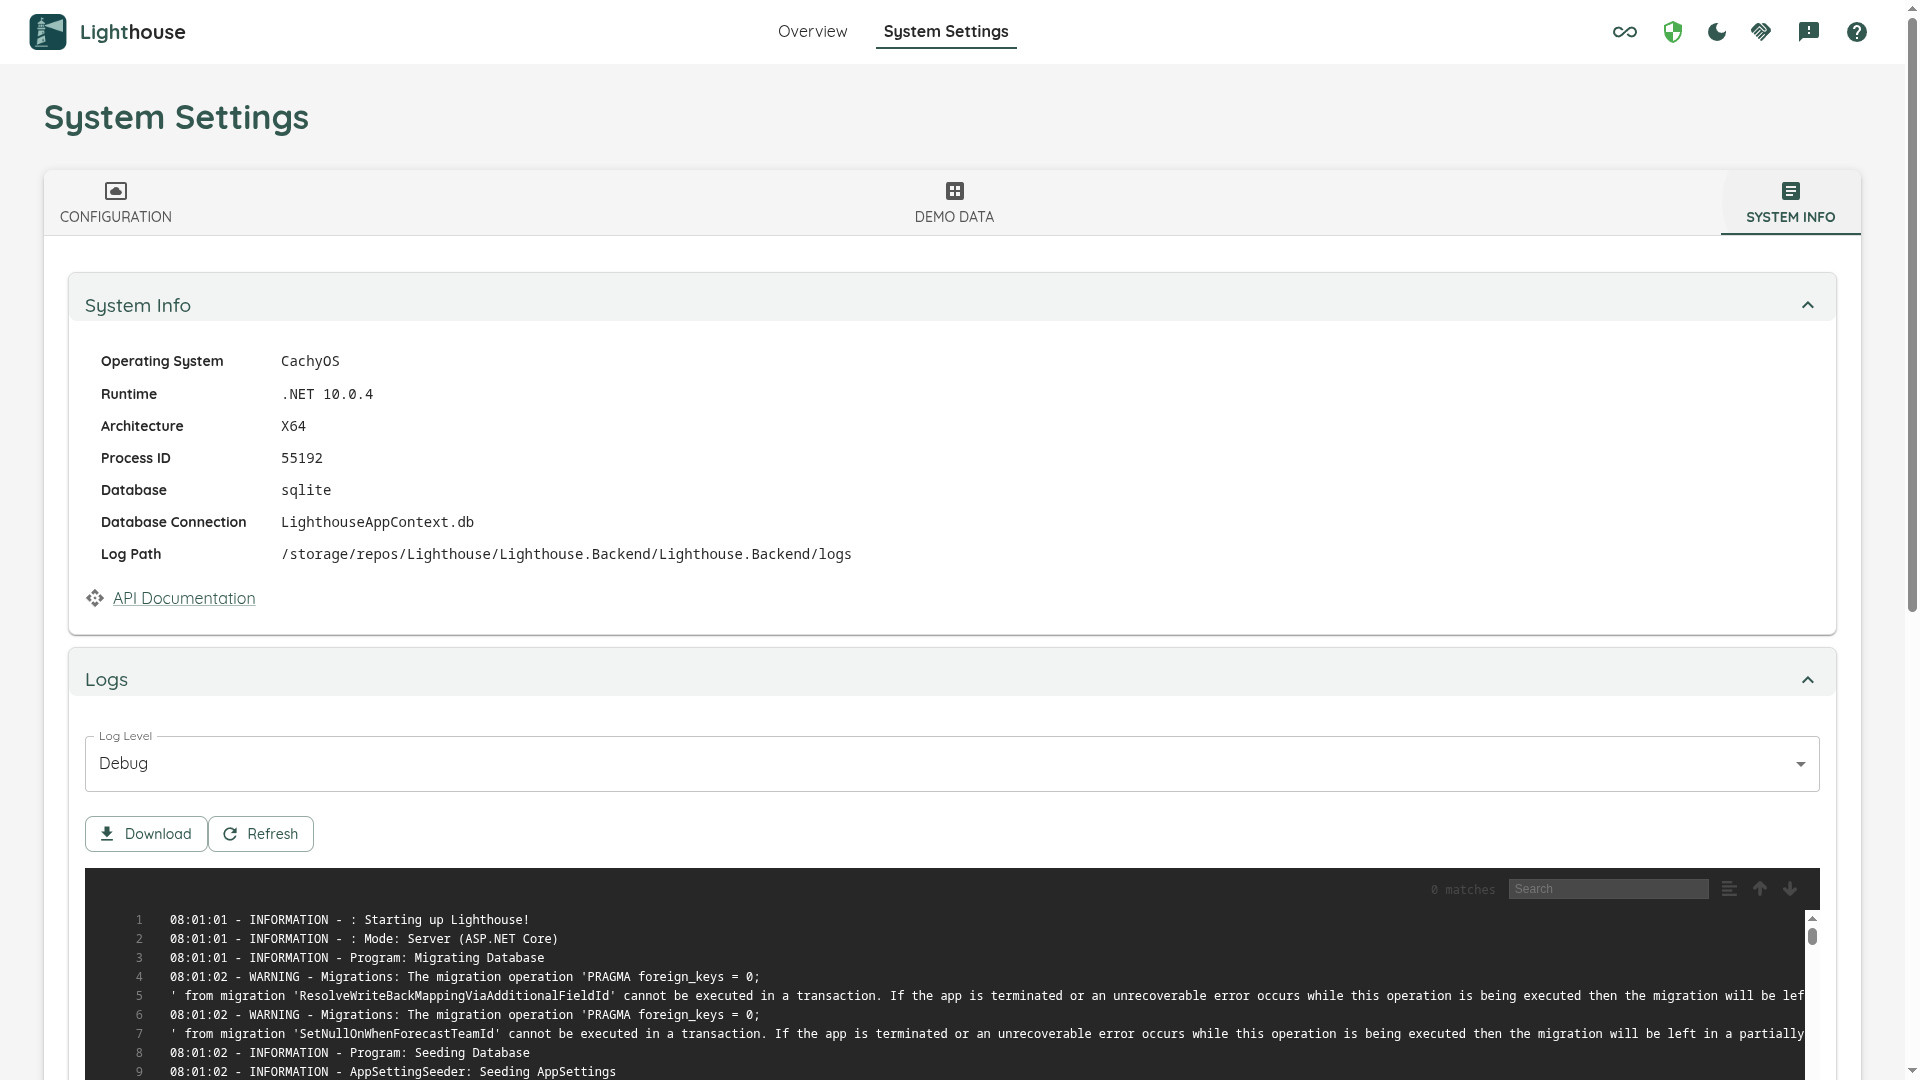
The Logs tab in System Settings has been renamed to System Info. In addition to the existing log viewer, it now displays details about your running Lighthouse instance — such as version information and other system properties. Clicking any of the displayed values copies it to your clipboard, making it easy to share when reporting issues or reaching out for support. A direct link to the API documentation (Swagger) is also available from this page.
Other Improvements and Bug Fixes
- Fixed an issue where deleting a team caused an error in case you deleted a Portfolio that included this team
- Removed fixed ports from config - plese check the configuration on how to set up https and override ports.
- Updated various third party dependencies
Contributions ❤️
Special thanks to everyone who contributed feedback for this release: