

An air-quality and weather lakehouse for the Mediterranean and North Africa,
rebuilt every day from real Open-Meteo, OpenAQ and WAQI data.


Live report · Architecture · ADR-001 · Changelog
A GitHub Actions cron builds Bronze, Silver, and Gold Delta tables on Backblaze B2, runs quality checks and anomaly detection, then publishes a fresh report to GitHub Pages. Nothing here is synthetic.
flowchart LR
    meteo["Open-Meteo<br/>CAMS air quality"] --> bronze
    era5["Open-Meteo<br/>ERA5 weather"] --> bronze
    openaq["OpenAQ v3"] --> bronze
    waqi["WAQI"] --> bronze
    bronze[("Bronze")] --> silver[("Silver")]
    silver --> gold[("Gold<br/>marts, alerts, anomalies")]
    gold --> report["Report and AI brief<br/>on GitHub Pages"]
    bronze -.-> checks{{"Quality checks"}}
    silver -.-> checks
    gold -.-> contracts{{"ODCS contracts"}}

    classDef bz fill:#c8833f,stroke:#8a5526,color:#1b1b1b
    classDef sv fill:#d5dbe2,stroke:#8a96a3,color:#1b1b1b
    classDef gd fill:#f2c14e,stroke:#b8891f,color:#1b1b1b
    class bronze bz
    class silver sv
    class gold gd
| Source | Input | Bronze path |
|---|---|---|
| Open-Meteo | CAMS daily PM2.5, PM10, NO2, O3 for 12 city grid points | s3://bronze/openmeteo/air_quality |
| Open-Meteo | ERA5 daily temperature, wind, rain, humidity and dust for the same 12 points | s3://bronze/openmeteo_weather/weather |
| OpenAQ v3 | Daily station aggregates across nine countries | s3://bronze/openaq/air_quality |
| WAQI | Current station readings for 15 city searches | s3://bronze/waqi/air_quality |
Silver lands in s3://silver/air_quality
station_id, station_name, city, country_code, latitude, longitude, date,
pm2_5, pm10, nitrogen_dioxide, ozone, pm2_5_source, aqi_category,
who_pm25_exceed, who_pm10_exceed, who_no2_exceed, who_o3_exceed,
data_completeness, source, silver_ts, partition_date
Roughly half of all rows carry a pollutant reading but no PM2.5, almost always
because the station has no PM2.5 sensor at all. Those are filled from the CAMS
model at the station's own coordinates, and pm2_5_source records which is
which: ground_sensor, model_estimated, or model_grid.
Weather lands separately in s3://silver/weather, one row per city per day
station_id, station_name, country_code, latitude, longitude, date,
temp_max_c, temp_min_c, temp_mean_c, apparent_temp_max_c, precipitation_mm,
wind_speed_max_kmh, wind_gust_max_kmh, humidity_pct, weather_code, dust,
condition, wind_level, dust_level, source, silver_ts, partition_date
condition comes from the WMO present-weather code (clear, cloudy, fog,
drizzle, rain, snow, thunderstorm). wind_level bands the day's strongest gust
on the Beaufort scale, and dust_level bands the CAMS dust concentration, which
is what a Saharan intrusion looks like in the data.
Gold holds daily_country_summary, wildfire_risk_index, anomaly_alerts, and
daily_country_weather.
WAQI reports IAQI index values rather than concentrations, so it feeds coverage and WHO reporting but is kept out of anomaly detection.
daily_country_weather carries a heat_alert and a cold_alert per country
per day. A day counts as unusually hot only if it clears two bars at once: 30 C
in absolute terms, and the 90th percentile of that station's own previous 30
days. The relative bar is what stops an ordinary Mediterranean August reading as
one long heatwave. The absolute bar is what stops a mild April day qualifying
merely because the fortnight before it was milder still.
One or two such days in a row is a heat_advisory, three or more a heatwave,
and a heatwave whose high reaches 40 C an extreme_heatwave. Cold alerts mirror
the shape against the 10th percentile and 5 C, with severe_cold_wave at or
below freezing. A station's first ten days get no verdict, because there is
nothing yet to compare them against.
The detection runs in Gold rather than Silver on purpose. Silver only ever sees the partitions it has not processed yet, and whether a day is a heatwave is a statement about the days around it.
The weather section of the report follows the meteorological season of the latest date and leads with the hazard that defines it around the Mediterranean:
| Season | Months | Focus | Charted |
|---|---|---|---|
| Winter | Dec to Feb | Cold | Nightly lows, cold-wave days |
| Spring | Mar to May | Saharan dust | Dust, days at high or severe |
| Summer | Jun to Aug | Heat | Daily highs, heatwave days |
| Autumn | Sep to Nov | Rain | Daily rain, days with 10 mm or more |
An active heatwave or cold wave takes over in any season. Dust peaks in spring
over the central and eastern basin
(Israelevich et al., 2012),
and autumn is the main flash-flood season
(NHESS, 2012).
The 10 mm bar is the ETCCDI heavy-precipitation index R10mm. To change what a
season shows, edit data/reporting/season.py.
The hosted lake is Backblaze B2. Local runs and CI use MinIO, where SQLMesh on DuckDB also builds and audits the Gold models. Every stage pushes Grafana Cloud metrics on a best-effort basis.
Every Delta write is followed by a checkpoint, so later reads skip replaying the log. That matters, because the B2 free tier caps Class B transactions per day and the pipeline is built to stay inside it.
The Gold stage is where that cap gets spent. Silver is partitioned by date, so reading it costs one object fetch per partition per source, and rebuilding all of Gold from all of Silver every night grew by four fetches a day forever. By late August 2026 it was 551 fetches a night, four fifths of the whole run, recomputing months of rows that had not changed since the day they landed.
So Gold now reads the last 60 days of Silver and rewrites the last 14 days of each table, splicing the result in front of the history already there. The gap between the two numbers is deliberate: a heat alert compares a day against its station's previous 30, so the oldest refreshed day still needs a month of lead-in behind it. The cost stays flat as history grows.
More detail in architecture and ADR-001.
Charts rebuild from the live Gold layer after every run. They are served from
Pages rather than committed, which keeps five months of regenerated PNGs out of
the git history. The notebook that produces them is
docs/pipeline_report.ipynb.
Station coverage by country and date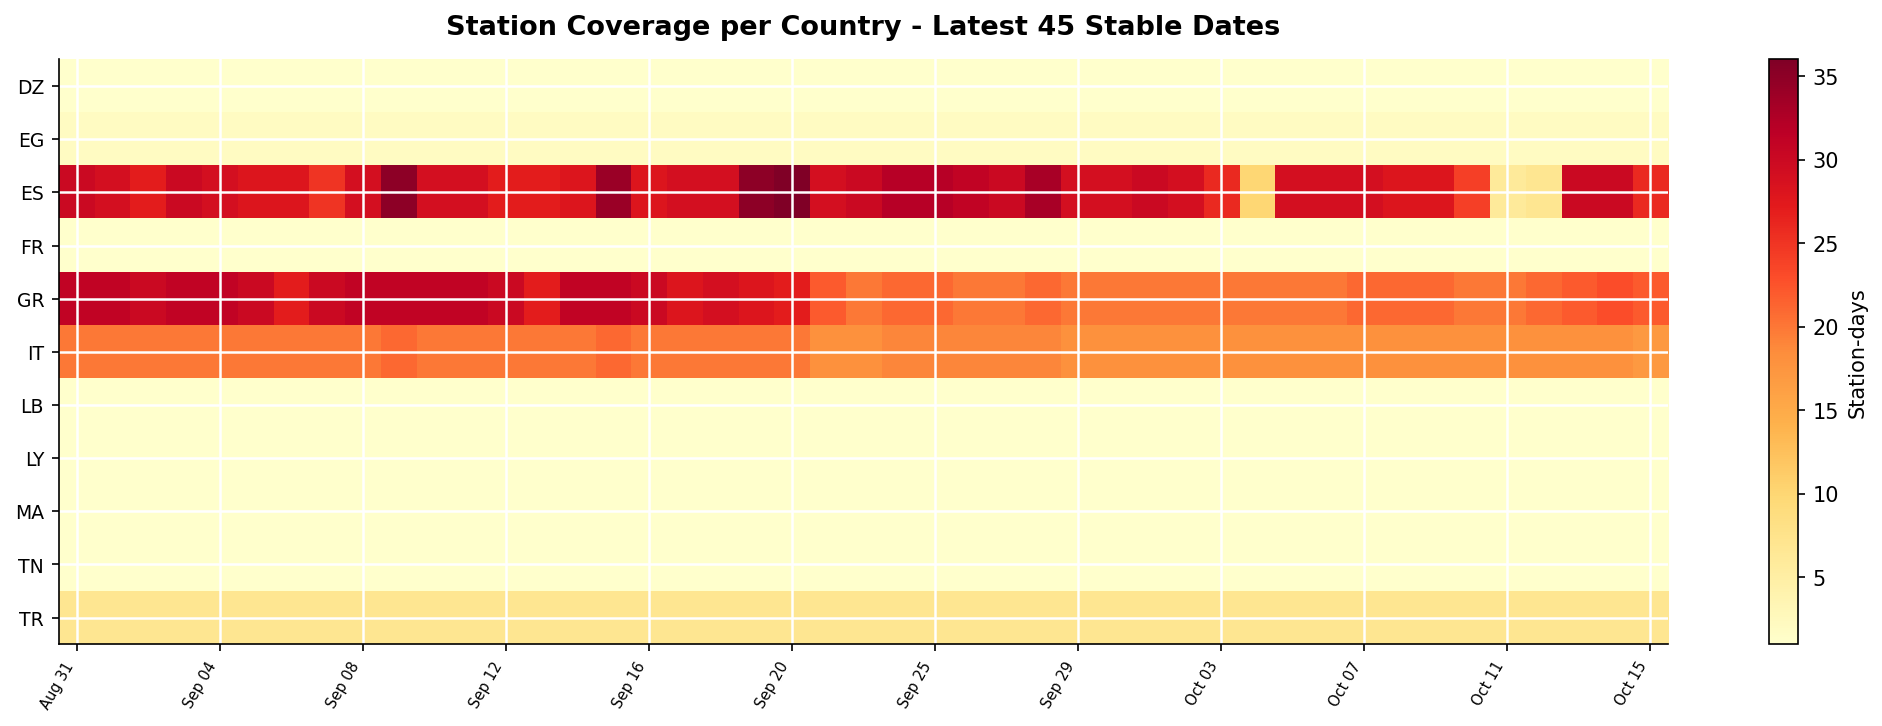
|
WHO guideline exceedance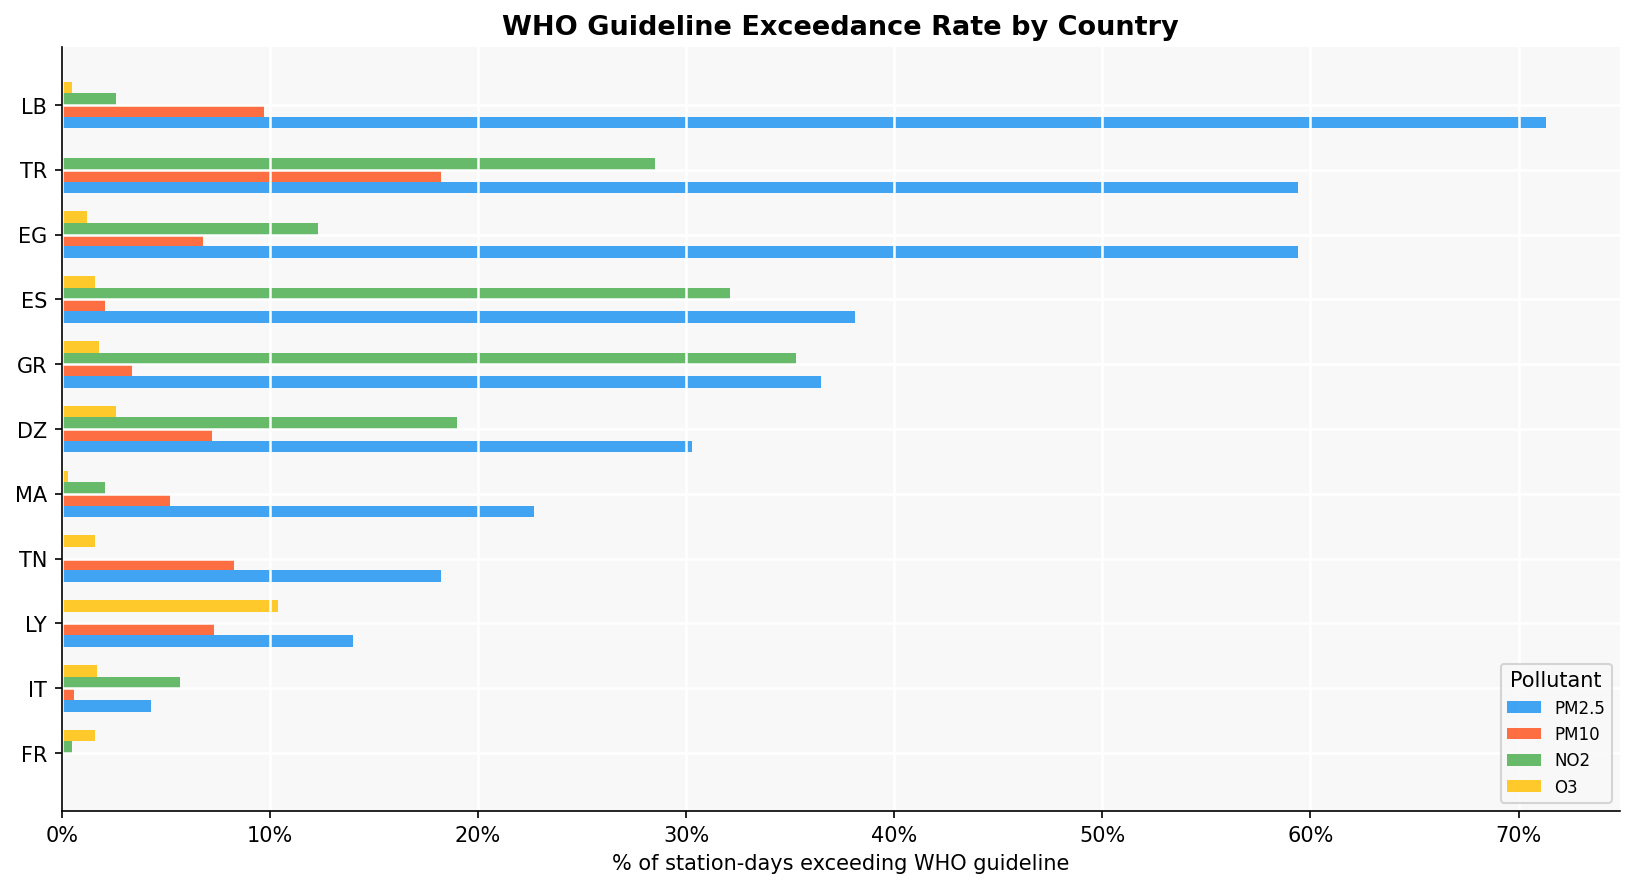
|
|
Seasonal weather per country Nightly lows and cold waves in winter, Saharan dust in spring, highs and heatwaves in summer, rain in autumn. 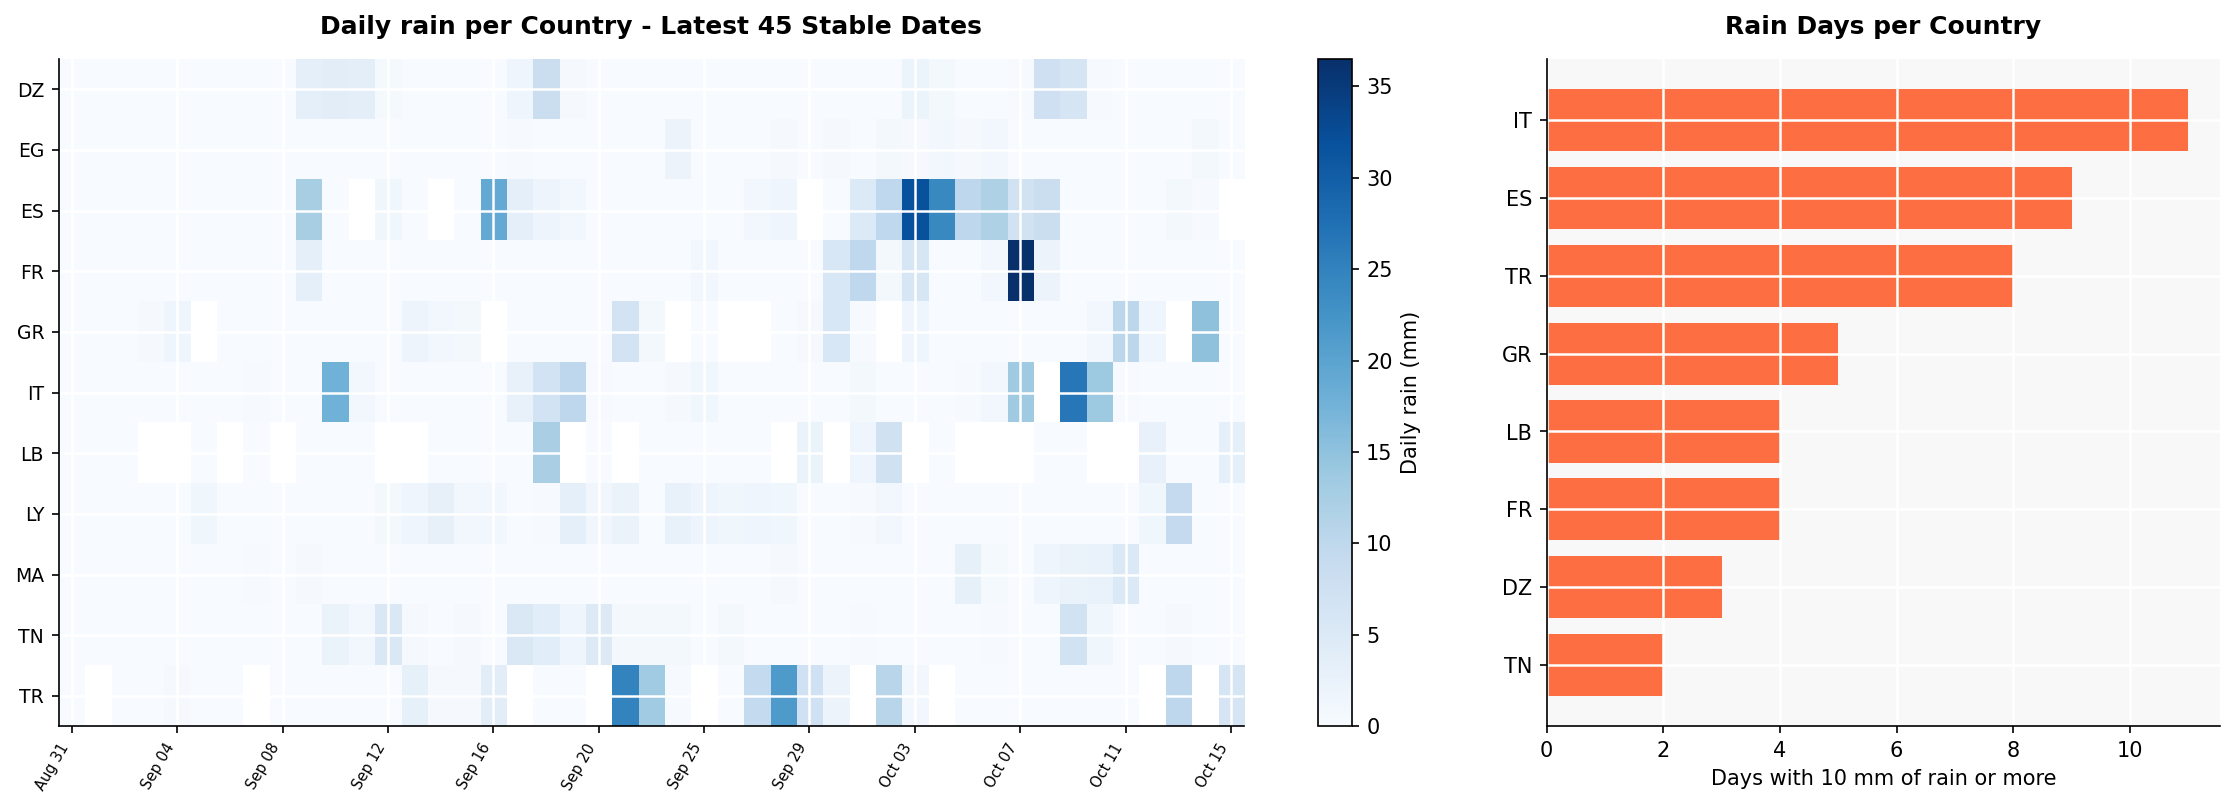
|
Top anomaly of the day Plotted against that day's spread across every station, so you can see why the model flagged it. 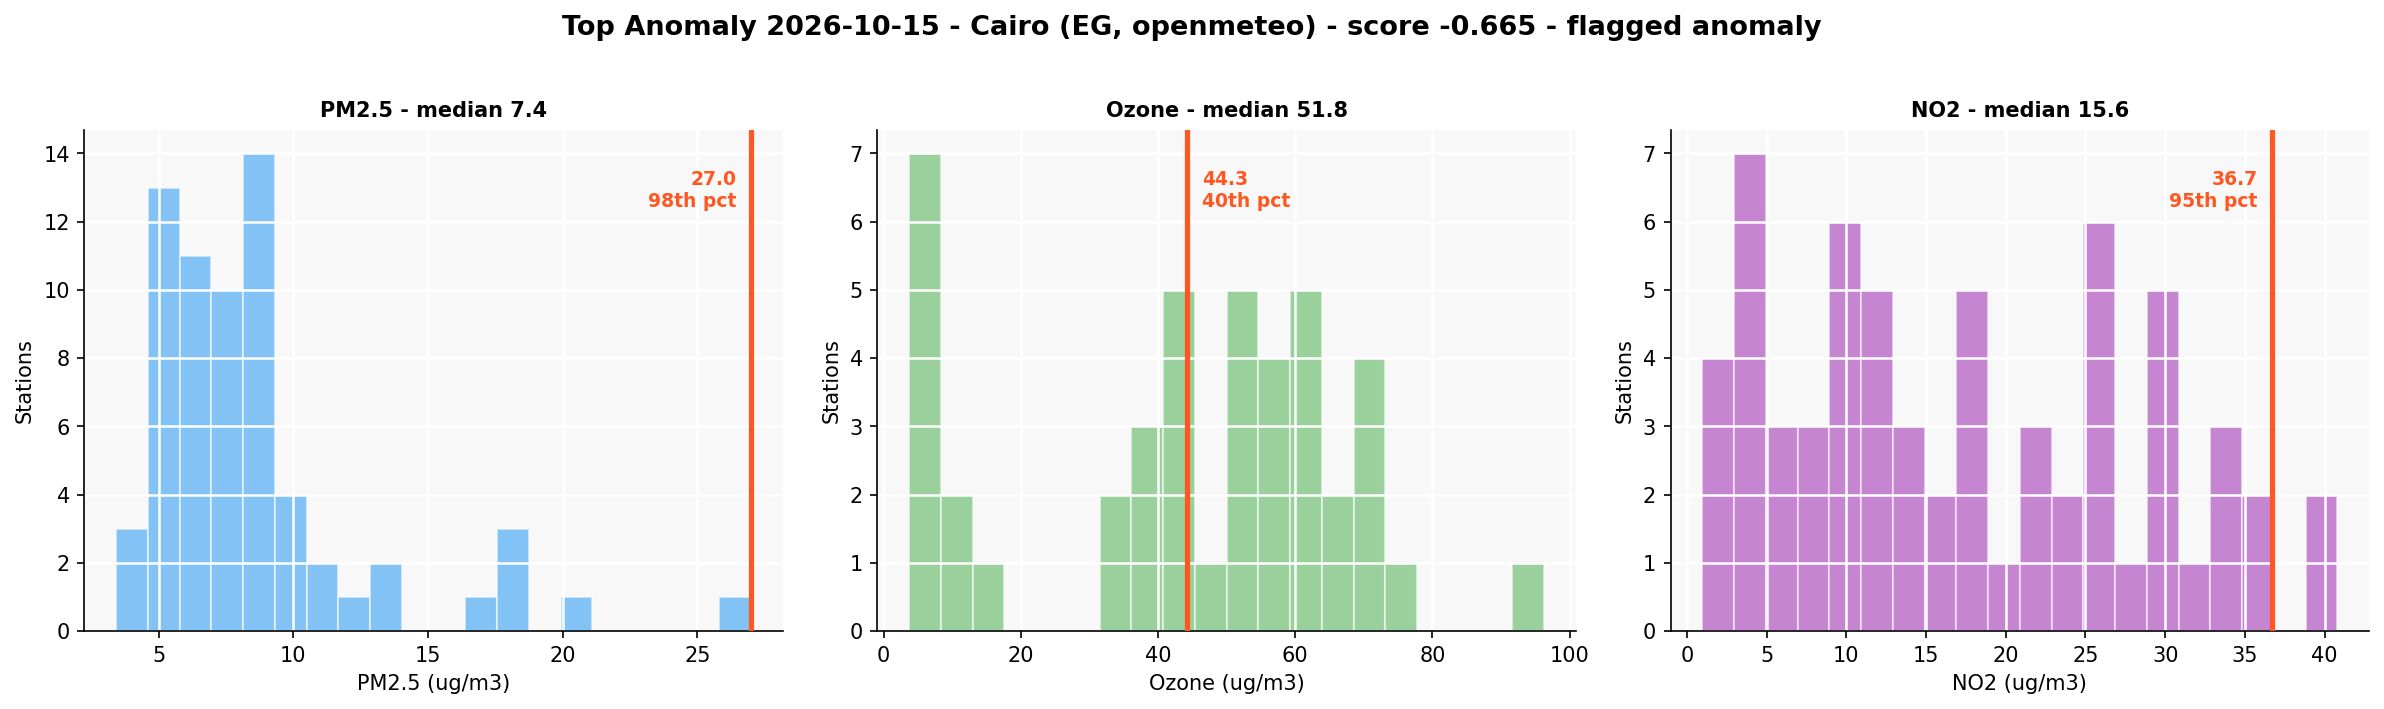
|
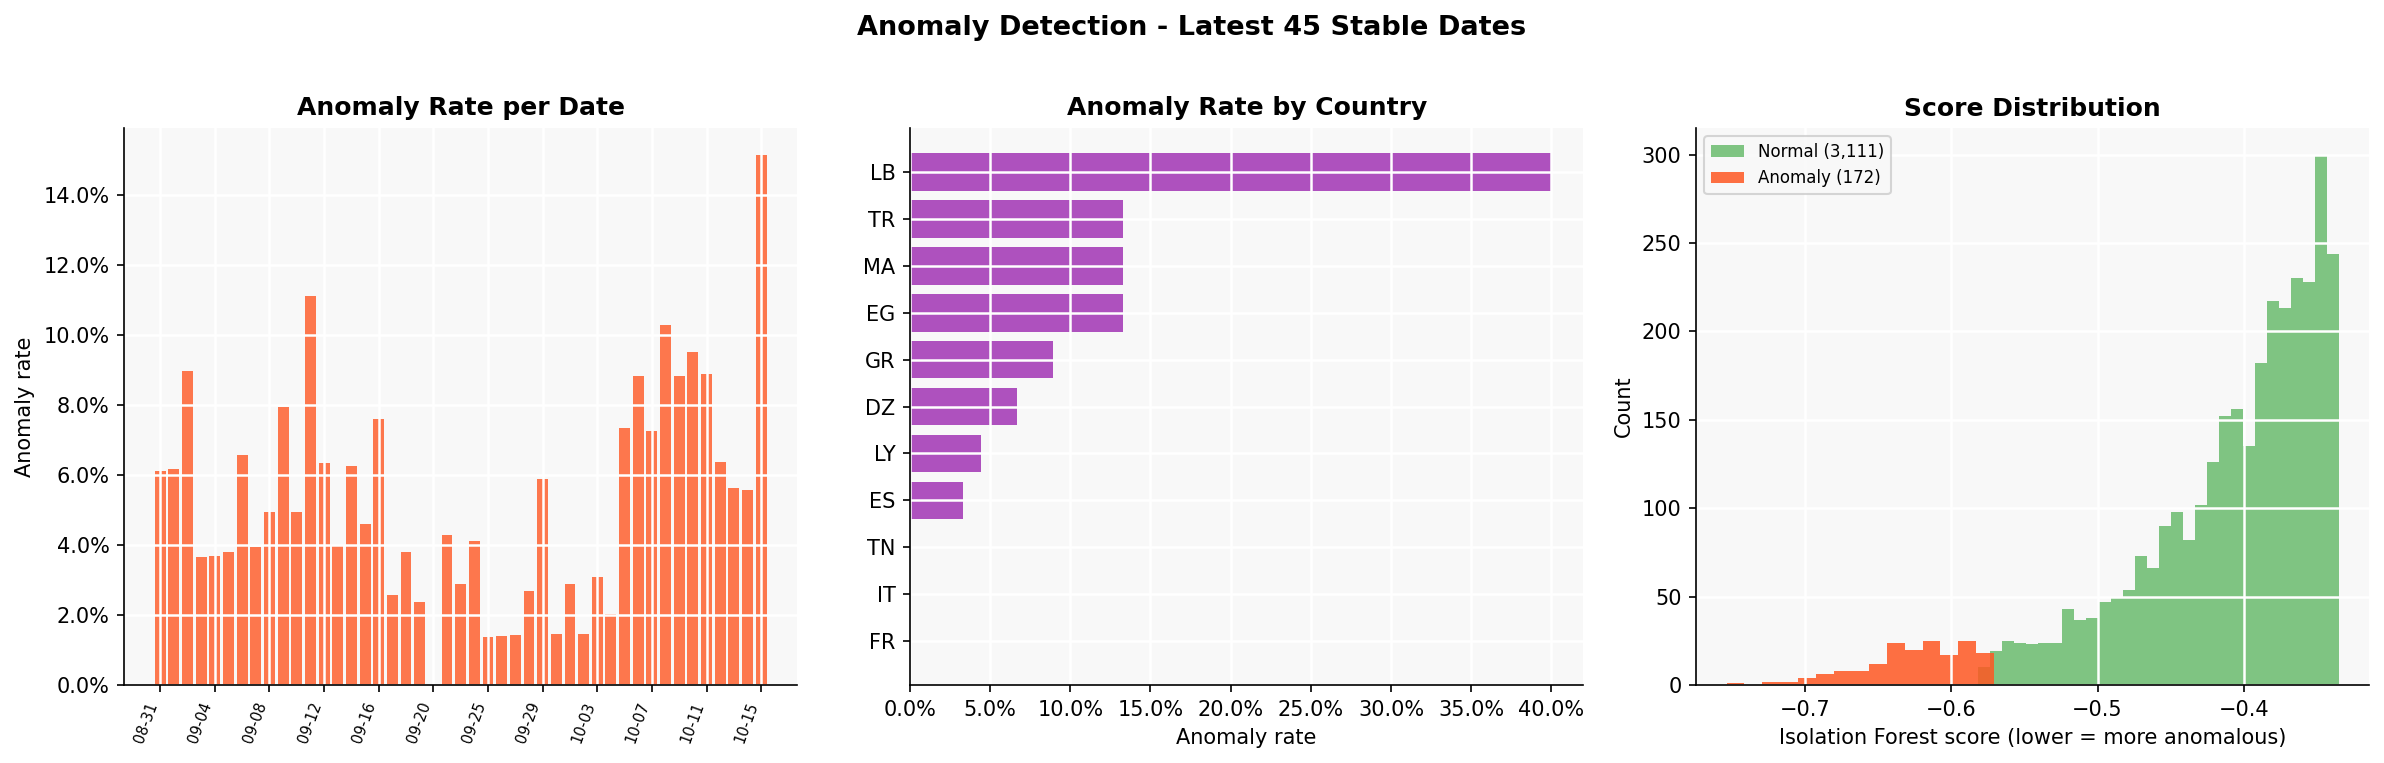
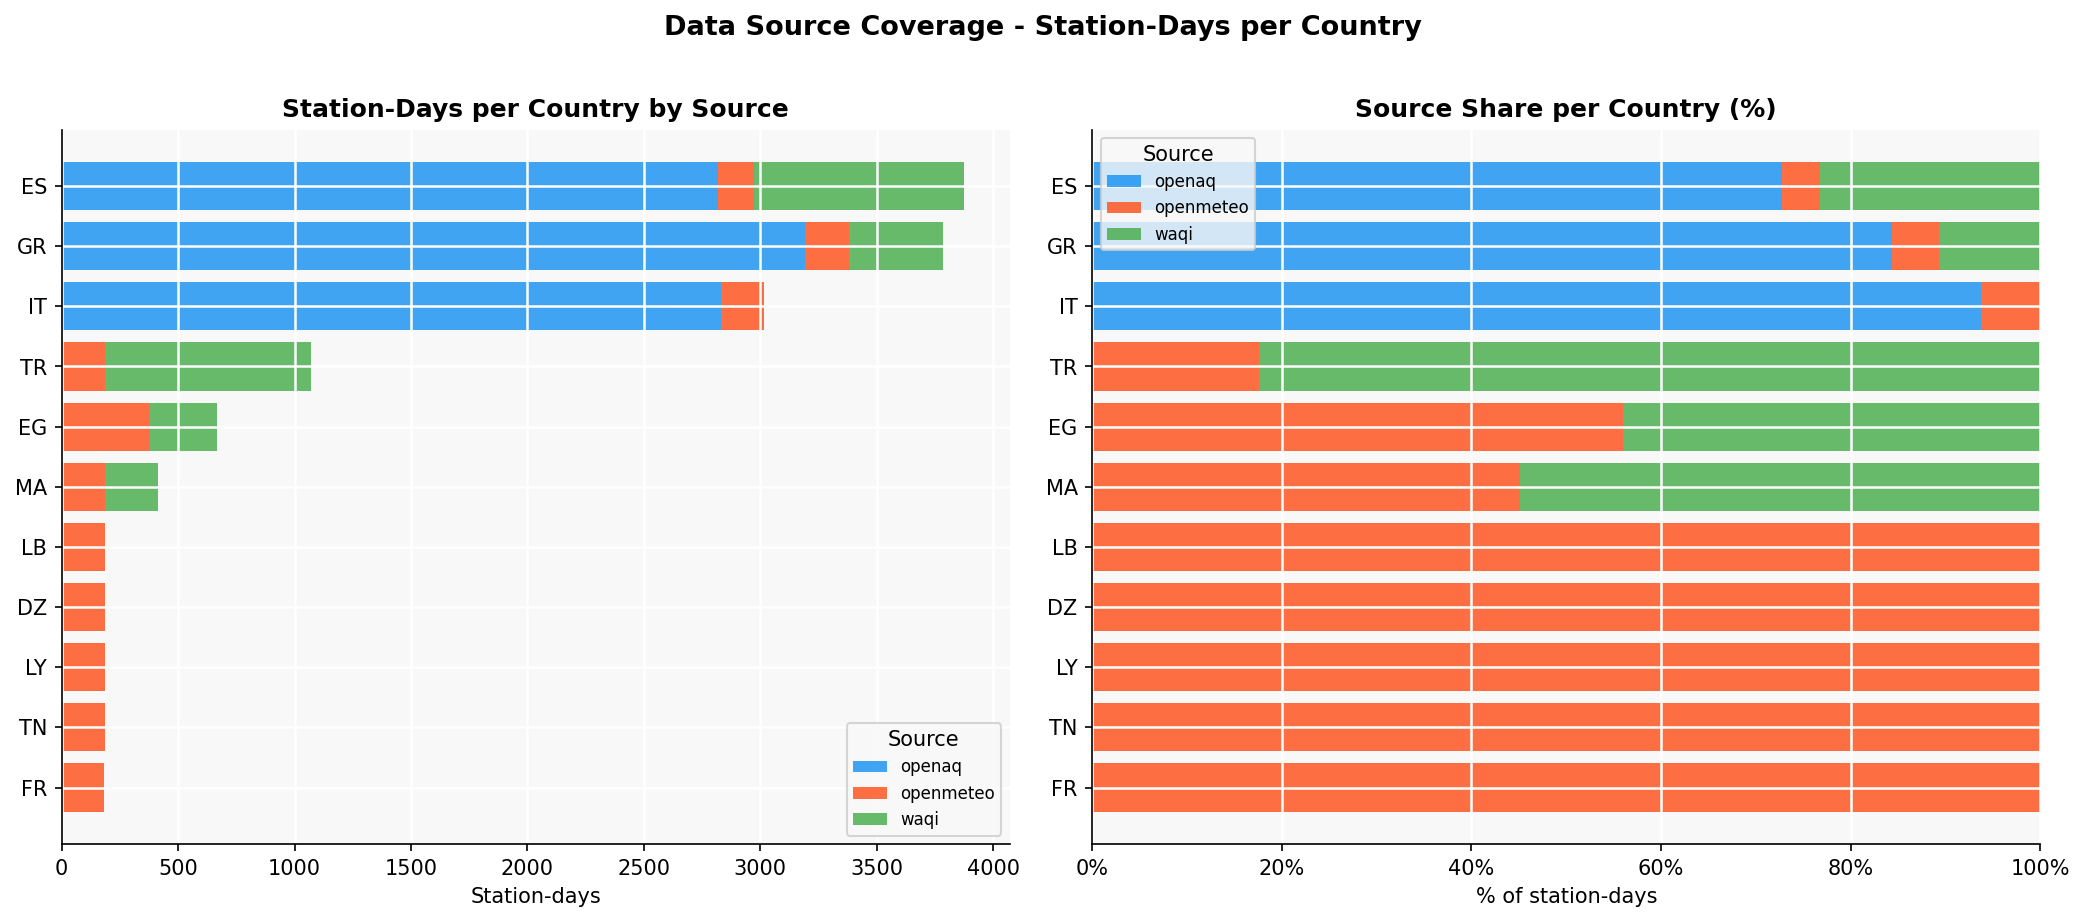
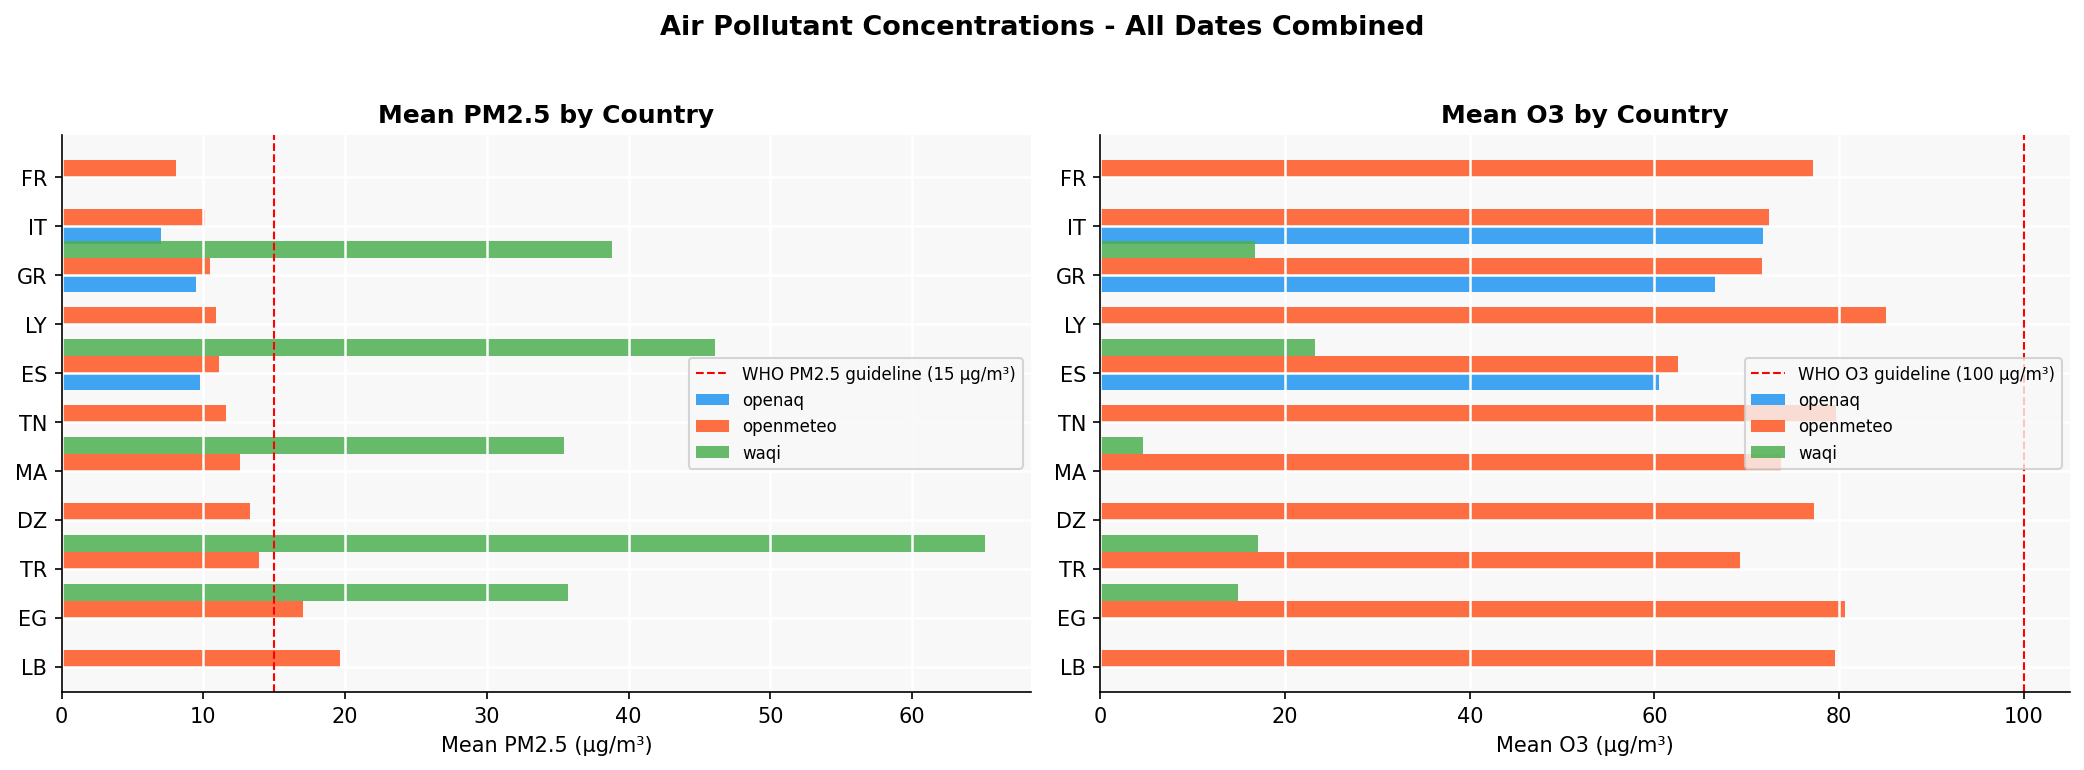
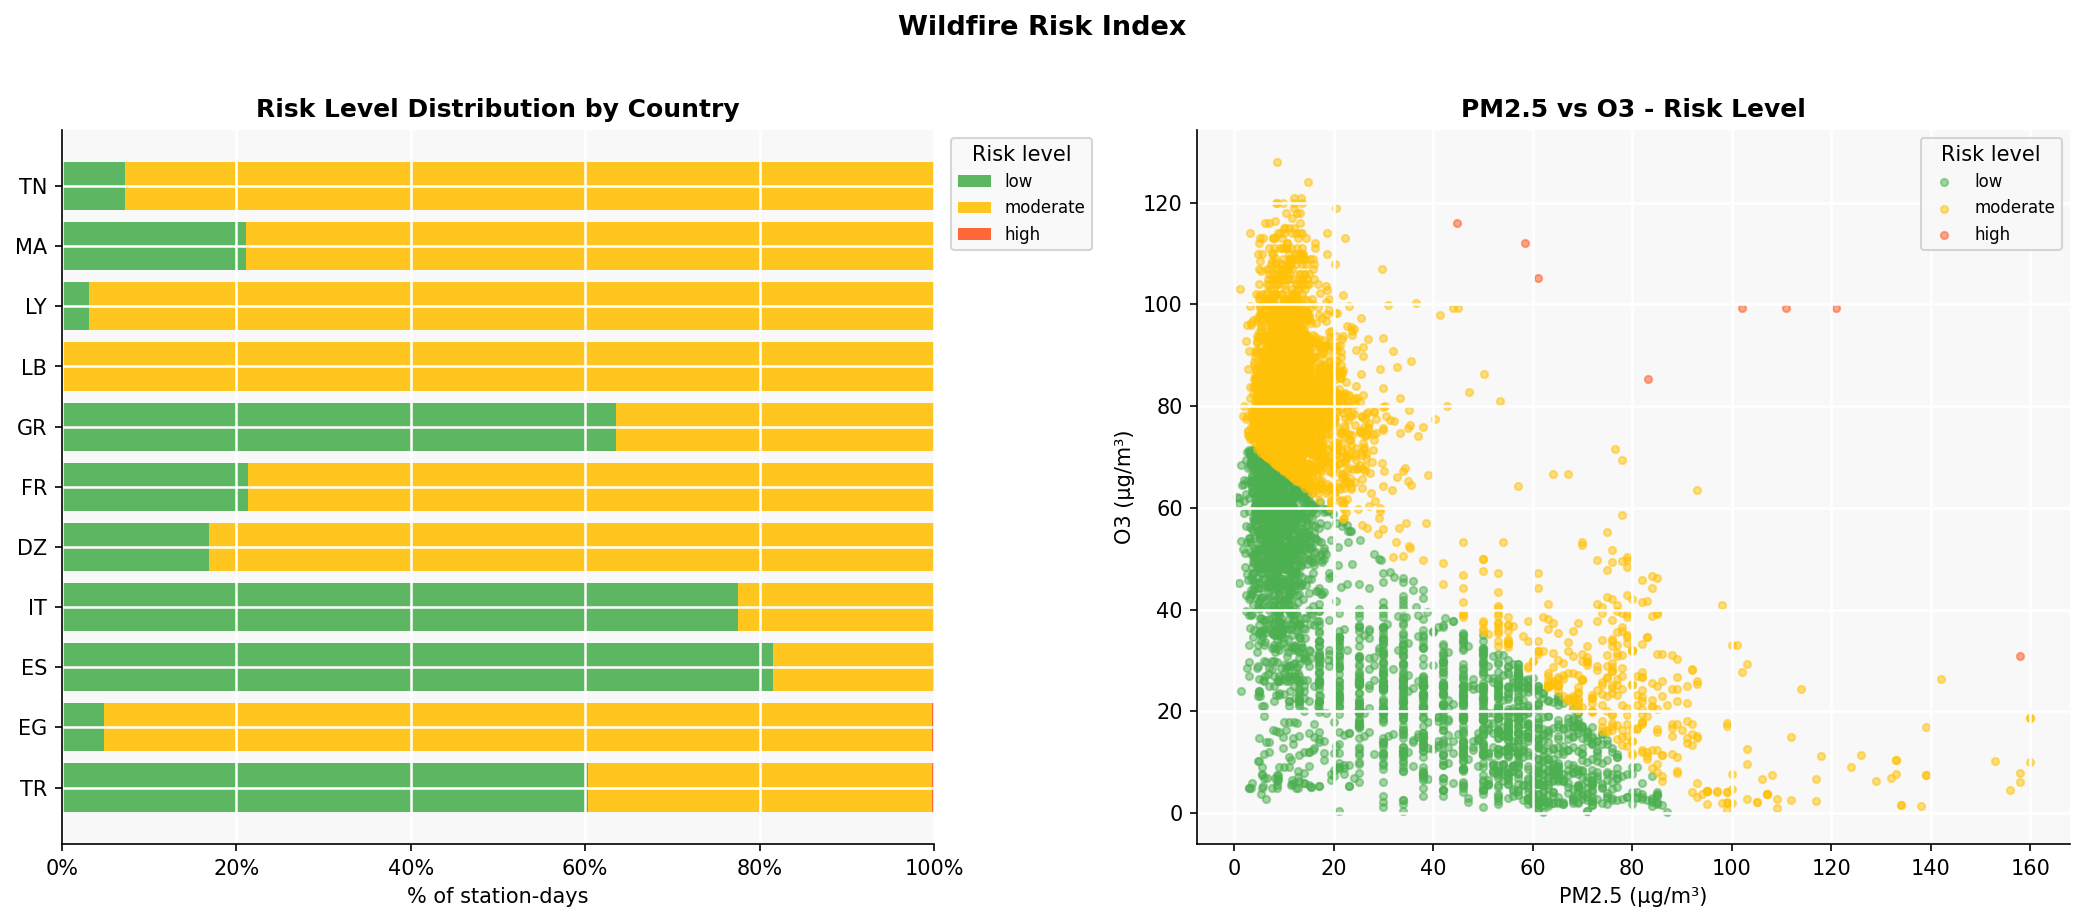
Also: anomaly detection, source coverage, pollutants by country, wildfire risk.
Three short generated sections in the report, all from that run's Gold layer:
- Anomaly fact-check. The day's top anomaly goes to the model with that day's distribution across all stations. Using Google Search grounding, it looks for a real explanation (wildfire, Saharan dust, heatwave, traffic) and says whether the reading is implausible, real and explained, or real and unexplained. It is told to report finding nothing as finding nothing, since an uncorroborated anomaly is the normal case. External claims carry source links.
- Country briefings. One to three sentences per country, using only that country's own numbers for the day: pollutants against WHO 2021 guidelines, plus the day's high, the conditions, and any heat or cold alert.
- Seasonal spotlight. A paragraph under the weather charts on the country leading the season's measure: the coldest night in winter, the most dust in spring, the hottest day in summer, the most rain over ten days in autumn. It says what weather at that level does to people or to the ground, and whether it arrived gradually or as a swing. Every figure in it, including the sharpest day-to-day change and the spread across the last ten days, is computed by the pipeline and handed over. Asking a model to spot a jump in a list is asking it to do arithmetic it is not reliably good at.
All three are labelled as generated text in the report. Every figure comes from the pipeline, not the model.
This runs on Gemini's free tier at no cost. The fact-check and the briefings
start on different models because neither model does both jobs. Briefings need
a response_format JSON schema, which gemini-3.7-flash honours and
gemini-2.5-flash ignores. The fact-check needs Search grounding, free on 2.5
and unavailable on 3.x.
Each of the two then walks a ladder of models and keeps the first usable answer.
Free-tier quota is counted per model, and gemini-3.7-flash allows only 20
requests a day, so a spent quota drops the section to gemini-2.5-flash and
then gemini-2.5-flash-lite instead of dropping it from the report. The caption
names the model that wrote it.
The spotlight runs its ladder cheapest-first. It is one paragraph over a dozen figures that are already computed, which the smallest model handles, and starting at the bottom keeps it out of the 20-a-day quota the briefings need.
To turn it on, get a key from Google AI Studio
(no card needed) and add it as a GEMINI_API_KEY repository secret under
Settings, Secrets and variables, Actions. Never commit the key. This repo is
public and scanners find committed keys within minutes. Without the secret the
pipeline runs as usual and the report omits the generated sections.
Raw output: ai_brief.json.
Python 3.11, Docker with Compose, and Make.
git clone https://github.com/ReguiguiMohamed/MediterraneanWillForge.git
cd MediterraneanWillForge
python -m venv .venv && source .venv/bin/activate
python -m pip install -r requirements-dev.txt
cp .env.example .env
make up
make up starts MinIO, Prometheus, Pushgateway, Alertmanager, and cAdvisor.
MinIO is at http://localhost:9001 with the credentials from .env.example.
make ingest hits the real APIs. OpenAQ works without a key at a lower rate
limit, WAQI needs WAQI_API_KEY. Do not point local runs at the hosted B2
buckets.
python -m ruff check data tests
python -m black --check data tests
python -m pytest tests/unit -v --cov=data
make test-integration          # MinIO, no public API calls
CI also builds both images, runs Silver and Gold against MinIO, checks the Gold output contracts, runs SQLMesh, and validates the Prometheus and Alertmanager config.
| Path | Contents |
|---|---|
.github/workflows/ |
CI, publishing, pipeline, and report workflows |
data/ingestion/ |
Bronze, Silver, and Gold jobs |
data/quality/ |
Bronze and Silver checks, Gold contract runner |
data/contracts/ |
Gold data contracts (ODCS, run by datacontract-cli) |
data/sqlmesh/ |
SQLMesh models, audits and unit tests on DuckDB |
data/reporting/ |
Report analytics and the AI brief |
docker/ |
Job images and the local Compose stack |
monitoring/ |
Local Prometheus and Alertmanager config |
grafana/ |
Grafana Cloud dashboard export |
docs/ |
Architecture, ADR, and the report notebook |
tests/ |
Unit and MinIO integration tests |
Python 3.11, Delta Lake (deltalake 0.18), pandas, scikit-learn, Great
Expectations, datacontract-cli, SQLMesh on DuckDB, Docker Compose, MinIO,
Backblaze B2, Prometheus, Grafana Cloud, Gemini, GitHub Actions and Pages.
- OpenAQ coverage is sparse and rate-limited, so zero-row days happen.
- WAQI has no free historical endpoint and reports IAQI, not concentrations.
- Weather covers the 12 city grid points, not every OpenAQ or WAQI station, so a country's alert describes its anchor cities. Tornadoes are not in the feed. The closest signal is a storm-force gust.
- Gold reads a 60-day window of Silver and rewrites its last 14 days, so a
partition that lands more than two weeks late needs a backfill run to reach
Gold. Backfills pass
GOLD_WINDOW_DAYS=alland rebuild in full. - SQLMesh runs against MinIO in CI only, never in the scheduled B2 pipeline.
- The AI brief is generated text. It is grounded in the pipeline's numbers and cites sources, but it is not a substitute for reading the data.
- Hosted runs need B2 and WAQI secrets. Grafana and
GEMINI_API_KEYare optional. - No SLA, no Kubernetes, no secrets manager. cAdvisor wants a Linux host.
Two open source projects carry the checks this pipeline relies on. Thanks to their maintainers and contributors.
- datacontract-cli (MIT)
by Jochen Christ, Stefan Negele, Simon Harrer and contributors. It tests
every Gold table against its ODCS contract in
data/contracts/. - SQLMesh (Apache 2.0) by the SQLMesh
contributors, started at Tobiko Data. It builds, audits and unit tests the
DuckDB models in
data/sqlmesh/.
Release history is in CHANGELOG.md.
MIT. Built by ReguiguiMohamed.