Cloud-native feature flag management system with control/data plane separation, CDN distribution, and dual-channel metrics/audit ingestion.
┌──────────────────────────────────┐       ┌─────────────────────────────┐
│ [heavy-client]                   │       │ [web-sdk]                   │
│ Backend Microservices            │       │Frontend Browser             │
│ SSE Local Cache Eval             │       │Static File Pull             │
│ Send to Ingest Service           │       │Send to Ingest Service       │
└──────┬───────────────────────────┘       └─────────────────────────────┘
       │                                             │
       │ (SSE Stream)                                │ (HTTP GET rules)
       │                           ┌─────────────────▼───────────────────┐
       │                           │ CDN Cache Layer (Nginx - Port 8084) │
       │                           │  Serves rules.<ver>.json            │
       │                           │  Cache Busting via manifest.json    │
       │                           └──────────────────▲──────────────────┘
       │                                              │
       │                                              │ (Write Snapshots)
┌──────▼───────────────────────────┐       ┌──────────┴──────────────────┐
│ Data Plane                       │       │ Control Plane               │
│  [flag-eval-service]             │       │  [admin-api]                │
│                                  │◄─────►│                             │
│  Pure In-Memory Evaluation       │[redis]│  CRUD Flags/Apps            │
│  SSE Long Connection Push        │Pub/Sub│  [postgres] Database        │
│  Rule Engine                     │       │                             │
└──────────────────────────────────┘       └─────────────────────────────┘


┌────────────────────────────────────────────────────────────────────────┐
│ [ingest-service] (Data Ingestion Layer)                                │
│ Data From Client & SDK                                                 │
│  - Pool A: Fire & Forget ──► [redis] High-Frequency Counter            │
│  - Pool B: Timeout Degradation ──► [kafka] Audit Log                   │
└──────┬─────────────────────────────────────────────┬───────────────────┘
       │                                             │
       │ (Periodic Flush)                            │ (Stream Consume)
       ▼                                             ▼
┌──────────────────────────────────┐       ┌─────────────────────────────┐
│ [metrics-worker]                 │       │ Kafka Consumer Engine       │
│  - Reads from Redis Counter      │       │  - Reads from Kafka Stream  │
└──────┬───────────────────────────┘       └─────────┬───────────────────┘
       │                                             │
       │ (Write Metrics Data)                        │ (Write Audit Logs)
       └─────────────────────┬───────────────────────┘
                             ▼
┌────────────────────────────────────────────────────────────────────────┐
│ OLAP Storage Layer [clickhouse]                                        │
│  - Hit Metrics Table (From metrics-worker Aggregated Telemetry)        │
│  - Audit Log Table   (From Kafka Stream Granular Trails)               │
└────────────────────────────▲───────────────────────────────────────────┘
                             │ (Query Analytics / Scrape Metrics)
┌────────────────────────────┴───────────────────────────────────────────┐
│ Observability Stack                                                    │
│  - [prometheus] : Pulls time-series metrics from core services         │
│  - [grafana]    : Dashboards pulling from Prometheus & ClickHouse      │
└────────────────────────────────────────────────────────────────────────┘
feature-management-service/
├── pom.xml                              # Maven Parent POM (multi-module)
├── flag-common/                         # [Shared Library] DTOs, enums, models, utils
├── flag-engine/                         # [Pure Engine] RuleEngine without Spring
├── flag-sdk-api/                        # [Interface] FlagSdkClient + DTOs
├── feature-flag-web-cdn/                # [Web SDK + CDN] Browser JS SDK + static files
├── flag-sdk-heavy-client/               # [Heavy SDK] SSE + local cache + WebFlux
├── flag-sdk-light-client/               # [Light SDK] Java 21 HttpClient, daemon batching
├── flag-admin-api/                      # [Control Plane] CRUD apps/flags, CDN publish
├── flag-eval-service/                   # [Data Plane] Pure in-memory evaluation
├── flag-ingest-service/                 # [Data Ingestion] Metrics + Audit log intake
├── flag-metrics-worker/                 # [Async Worker] Redis→ClickHouse batch flush
└── deploy/
    ├── docker/                          # Docker compose + Dockerfiles + configs
    ├── scripts/                         # Integration tests, deploy, health check
- Admin API (Control Plane) — direct PostgreSQL, transactional outbox → Redis Pub/Sub
- EvalService (Data Plane) — pure in-memory, zero DB at runtime, detects changes via Redis
- CDN Snapshot — admin-api writes directly to shared volume, Nginx serves statically
- Server-only flags (
safe_for_client = FALSE) are physically excluded at the query level - They never enter the CDN pipeline — security by architecture, not by convention
- Pool A (Metrics): Fire & Forget, never blocks,
CallerRunsPolicy - Pool B (Audit Log): 200ms timeout, auto-discard with counting
- Two thread pools fully isolated — blocking one channel does not affect the other
- Write to temp file → OS-level
FileLock→ atomic rename → overwrite manifest - Multi-instance safe: concurrent admin nodes lock via
FileChannel.tryLock() - Version counter prevents stale read: manifest points to
rules.<N>.json
- EvalService maintains independent
Sinks.Manyper AppId - On rule changes, only pushes changes to connected clients of the corresponding app
- Heartbeat via SSE comment line (protocol-level, no DTO pollution)
- All persistence timestamps (
recorded_at) server-generated - Prevents client clock skew from causing ClickHouse partition explosion
appIdpassed at method call time (isEnabled(appId, flagKey, context))- No instance-level appId binding — single SDK instance serves multiple apps
- Global aggregator batches metrics + audit logs across all apps
| Component | Requirement |
|---|---|
| JDK | 21+ (Eclipse Adoptium or equivalent) |
| Maven | 3.9+ |
| Docker | Docker Desktop (with docker compose v2) |
mvn clean package -DskipTestscd deploy/docker
docker compose up -d --buildThis starts all 11 containers:
Microservices (4):
| Service | Container | Port | Role |
|---|---|---|---|
| Admin API | flag-admin-api |
8080 | Control Plane: CRUD apps, flags, CDN publish |
| EvalService | flag-eval-service |
8081 | Data Plane: pure in-memory flag evaluation |
| IngestService | flag-ingest-service |
8082 | Data ingestion: metrics + audit logs |
| MetricsWorker | flag-metrics-worker |
8083 | Async: Redis → ClickHouse flush |
Infrastructure (7):
| Component | Container | Port | Purpose |
|---|---|---|---|
| PostgreSQL | flag-postgres |
5432 | Flag metadata (apps, flags, rules) |
| Redis | flag-redis |
6379 | Pub/Sub notifications + metrics counters |
| Kafka | flag-kafka |
9092 | Audit log buffering |
| ClickHouse | flag-clickhouse |
8123 | Analytics storage (metrics + audit) |
| CDN Nginx | flag-cdn |
8084 | Serves rule snapshots + Web SDK |
| Prometheus | flag-prometheus |
9090 | Time-series metrics scraping |
| Grafana | flag-grafana |
33000 | Dashboards (ClickHouse + Prometheus) |
# One-shot health check
bash deploy/scripts/health-check.sh

# Or check individually
curl -s http://localhost:8080/actuator/health   # Admin API
curl -s http://localhost:8081/actuator/health   # EvalService
curl -s http://localhost:8082/actuator/health   # IngestService
curl -s http://localhost:8083/actuator/health   # MetricsWorker
curl -s http://localhost:8084/__headers         # CDN Nginx
All services should return {"status":"UP"}.
# Full integration test (creates app → flags → eval → ingest → verify ClickHouse)
python3 deploy/scripts/integration-test.py

# With custom ports / wait times
python3 deploy/scripts/integration-test.py --admin http://admin:8080 --wait 2

# E2E browser test (requires Playwright: playwright install chromium)
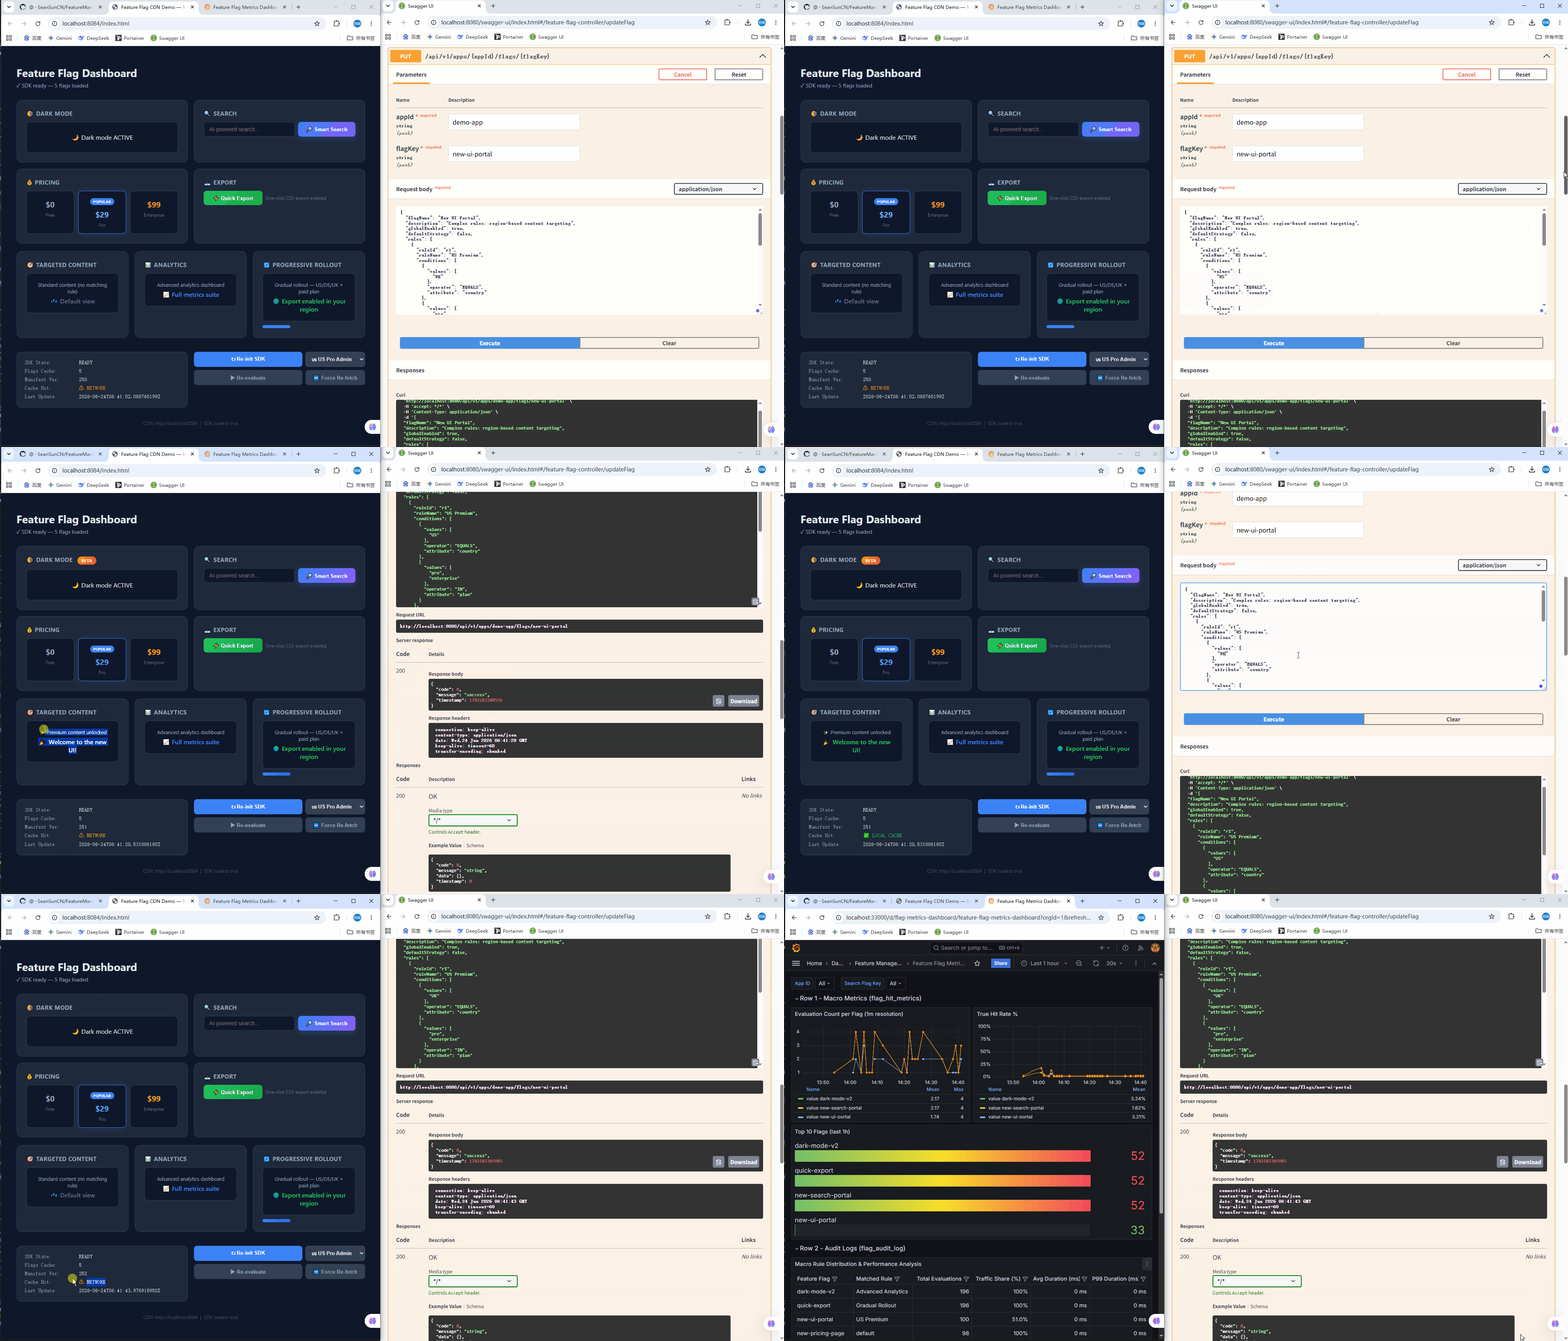
python3 deploy/scripts/e2e-playwright.pyOpen in browser: http://localhost:8084/index.html
The demo page:
- Loads the Web SDK from CDN
- Fetches demo app rules (auto-provisioned by integration test)
- Shows 5 feature flags with toggle switches
- Demonstrates multi-profile testing (US Premium, EU Beta, etc.)
- Click "Evaluate All" to test different user profiles
- Click "Refresh Rules" to re-fetch from CDN
- Telemetry (metrics + audit logs) flushes every 5s
The demo includes complex rule flags for testing:
| Profile | Country | Plan | Beta | Eval Count |
|---|---|---|---|---|
| US Premium | US | pro | false | 150 |
| EU Beta | DE | free | true | 20 |
| CN Visitor | CN | free | false | 5 |
Rules tested:
flag-multi-rule: 2 rules, 3 conditions each (EQUALS, IN, NOT_IN, GREATER_THAN)flag-all-ops: 6 rules, one per operator (EQUALS, NOT_EQUALS, IN, NOT_IN, GREATER_THAN, LESS_THAN)
Flag mutation (create/update/delete)
       │
       ▼
FeatureFlagService (flag-admin-api)
       │
       ├─► Save to PostgreSQL (transactional outbox → Redis Pub/Sub → EvalService refresh)
       │
       └─► CdnSnapshotService.publishAllSafeFlags()
                │
                ├─1─► SQL: SELECT * FROM flag_feature WHERE safe_for_client = TRUE
                │        (physical isolation — server-only flags never leave DB)
                │
                ├─2─► RuleCompiler.publishSnapshot(clientFlags)
                │        │
                │        ├─► Write rules.<ver>.json.tmp
                │        ├─► Acquire FileLock on manifest.json (OS-level, multi-instance safe)
                │        ├─► Atomic rename .tmp → rules.<ver>.json
                │        └─► Overwrite manifest.json with new latest_file pointer
                │
                └─3─► CDN Nginx serves rules.<ver>.json via HTTP
                         (Cache-Control: public, immutable, max-age=31536000)
Admin API (flag-admin-api)
  │  POST/PUT/PATCH/DELETE flag → JPA save → FlagOutbox entry
  │
  ├─► Redis Pub/Sub: publish flag-change message
  │     Topic: flag:change:<appId>
  │     Payload: { appId, flagKey, changeType, version }
  │
  ▼
EvalService (flag-eval-service)
  │  FlagChangeListener @EventListener
  │
  ├─► FlagCache: update/evict per-appId ConcurrentHashMap
  ├─► SSE: push flag:changed event to all connected clients of that appId
  │     Path: GET /api/v1/eval/sse/subscribe?appId=xxx
  │     Format: SSE text/event-stream, heartbeat via SSE comment line
  │
  └─► Ready for next /evaluate call (zero DB hit at runtime)
SDK isEnabled() evaluation
       │
       ├─► (local counter increment: appId + flagKey)
       │
       ▼ (periodic flush: 5s Light SDK / 5min Web SDK / 60s Heavy SDK)
IngestService (flag-ingest-service)
  │  POST /api/v1/ingest/metrics
  │  MetricsChannel (Pool A: Fire & Forget, CallerRunsPolicy)
  │
  ├─► Redis HINCRBY flag:metrics:<appId>:<flagKey> {hits, eval_count}
  │
  ▼ (every 10s: MetricsFlushService)
MetricsWorker (flag-metrics-worker)
  │  RENAME flag:metrics → flag:metrics:flush:<timestamp>
  │  Scan all fields, parse compound keys, aggregate
  │
  ├─► Batch INSERT into flag.flag_hit_metrics
  │     (app_id, flag_key, hits, eval_count, recorded_at)
  │
  ▼
ClickHouse flag.flag_hit_metrics table
  │  MergeTree engine, ORDER BY (app_id, flag_key, recorded_at)
  │  TTL 90 days
  │
  ▼
Grafana Dashboard: Evaluation Count, True Hit Rate %, Top 10 Flags
SDK isEnabled() evaluation
       │
       ├─► (build AuditLogEntry: appId, flagKey, userId, enabled,
       │     matchedRule, attributesSnapshot, evalCostNs)
       │
       ▼ (periodic batch flush: same interval as metrics)
IngestService (flag-ingest-service)
  │  POST /api/v1/ingest/audit-log/batch
  │  AuditLogChannel (Pool B: 200ms timeout, auto-discard with drop counter)
  │
  ├─► Kafka topic "flag-audit-log" (3 partitions)
  │     Key: appId, Value: JSON with server-side timestamp injection
  │
  ▼ (Kafka Engine stream consumption)
ClickHouse kafka_flag_audit_log_queue (Kafka Engine table)
  │  kafka_format = 'JSONAsString', 3 consumers
  │
  ├─► Materialized View: mv_kafka_to_flag_audit_log
  │     Parses JSON fields via JSONExtract*
  │     TO flag.flag_audit_log
  │
  ▼
ClickHouse flag.flag_audit_log table
  │  MergeTree engine, ORDER BY (app_id, flag_key, recorded_at)
  │  TTL 90 days
  │
  ▼
Grafana Dashboard: User Hit Trace, Eval Latency
Admin API flag change
       │
       ▼
Redis Pub/Sub → EvalService FlagChangeListener
       │
       ├─► Update FlagCache (ConcurrentHashMap)
       │
       ▼
SseController (GET /api/v1/eval/sse/subscribe?appId=xxx)
  │  Maintains per-appId Sinks.Many (independent SSE connections)
  │
  ├─► Push flag:changed event to all subscribers of that appId
  ├─► Heartbeat via SSE comment line every N seconds
  │
  ▼
Heavy SDK SseStreamManager
  │  Receives SSE events → FlagEntryParser
  │
  ├─► Update local FeatureDataStore (ConcurrentHashMap + ReadWriteLock)
  ├─► Next isEnabled() call uses local cache (0ms, no network)
  │
  └─► Cache miss fallback → remoteEvaluate via WebClient
| Port | Service | Container |
|---|---|---|
| 8080 | Admin API | flag-admin-api |
| 8081 | EvalService | flag-eval-service |
| 8082 | IngestService | flag-ingest-service |
| 8083 | MetricsWorker | flag-metrics-worker |
| 8084 | CDN Nginx | flag-cdn |
| 8123 | ClickHouse HTTP | flag-clickhouse |
| 9090 | Prometheus | flag-prometheus |
| 9092 | Kafka | flag-kafka |
| 6379 | Redis | flag-redis |
| 5432 | PostgreSQL | flag-postgres |
| 33000 | Grafana (mapped) | flag-grafana |
Each microservice has built-in Swagger UI via Springdoc OpenAPI:
| Service | Swagger UI URL |
|---|---|
| Admin API | http://localhost:8080/swagger-ui.html |
| EvalService | http://localhost:8081/swagger-ui.html |
| IngestService | http://localhost:8082/swagger-ui.html |
| MetricsWorker | http://localhost:8083/swagger-ui.html |
| Method | Path | Description |
|---|---|---|
| GET | /api/v1/apps | List all applications |
| POST | /api/v1/apps | Create an application |
| GET | /api/v1/apps/{appId} | Get a single application |
| PUT | /api/v1/apps/{appId} | Update an application |
| DELETE | /api/v1/apps/{appId} | Delete an application (cascading flag delete) |
| GET | /api/v1/apps/{appId}/flags | List all flags for an application |
| POST | /api/v1/apps/{appId}/flags | Create a feature flag |
| GET | /api/v1/apps/{appId}/flags/{flagKey} | Get a single feature flag |
| PUT | /api/v1/apps/{appId}/flags/{flagKey} | Update a feature flag |
| DELETE | /api/v1/apps/{appId}/flags/{flagKey} | Delete a feature flag |
| PATCH | /api/v1/apps/{appId}/flags/{flagKey}/enabled | Enable/disable a flag |
| POST | /api/v1/apps/{appId}/flags/reload | Trigger full refresh push |
| Method | Path | Description |
|---|---|---|
| POST | /api/v1/eval/evaluate | Evaluate a single flag |
| POST | /api/v1/eval/evaluate/batch | Batch evaluate multiple flags |
| GET | /api/v1/eval/flags?appId=xxx | Get full rule snapshot for an app |
| GET | /api/v1/eval/sse/subscribe?appId=xxx | SSE stream for real-time flag updates |
| Method | Path | Description |
|---|---|---|
| POST | /api/v1/ingest/metrics | Report evaluation metrics (Fire & Forget) |
| POST | /api/v1/ingest/audit-log | Report single audit log entry |
| POST | /api/v1/ingest/audit-log/batch | Batch report audit log entries |
| GET | /api/v1/ingest/drop-total | Count of dropped audit logs (degraded discards) |
| Method | Path | Cache | Description |
|---|---|---|---|
| GET | /manifest.json | no-store | Latest rules file pointer (cache busting) |
| GET | /rules.{ver}.json | 365 days | Versioned client-safe flag rules |
| GET | /feature-flag-web-sdk.js | 1 hour | Web SDK for browser evaluation |
| GET | / | no-cache | Static assets (HTML, images) |
| GET | /__headers | - | Debug: echo request headers |
Tables auto-created by ddl-auto: update:
| Table | Description | Key Columns |
|---|---|---|
app |
Application registry | app_id (PK), app_name, app_type |
feature_flag |
Feature flag definitions | id (PK), app_id (FK), flag_key, enabled, rules JSON, safe_for_client |
flag_outbox |
Transactional outbox for Redis Pub/Sub | id, app_id, event_type, payload JSON |
flag_history |
Change audit trail | id, app_id, flag_key, change_type, timestamp |
Manual init (if needed):
docker exec -i flag-postgres psql -U postgres -d flag_db < deploy/scripts/postgres-init.sqlTwo tables + Kafka Engine + Materialized View, defined in deploy/scripts/clickhouse-init.sql:
-- 1. Hit metrics (from MetricsWorker periodic flush)
CREATE TABLE flag.flag_hit_metrics (
    app_id String, flag_key String, hits UInt64, eval_count UInt64,
    recorded_at DateTime('UTC')
) ENGINE = MergeTree() PARTITION BY toYYYYMM(recorded_at)
  ORDER BY (app_id, flag_key, recorded_at) TTL recorded_at + INTERVAL 90 DAY DELETE;

-- 2. Audit log table (via Kafka → MV)
CREATE TABLE flag.flag_audit_log (
    app_id String, flag_key String, user_id String, enabled UInt8,
    matched_rule String, client_ip String, attributes_snapshot String,
    eval_cost_ns UInt64, recorded_at DateTime('UTC')
) ENGINE = MergeTree() PARTITION BY toYYYYMM(recorded_at)
  ORDER BY (app_id, flag_key, recorded_at) TTL recorded_at + INTERVAL 90 DAY DELETE;

-- 3. Kafka engine queue (reads from "flag-audit-log" topic)
CREATE TABLE flag.kafka_flag_audit_log_queue (message String)
  ENGINE = Kafka SETTINGS kafka_broker_list = 'flag-kafka:9092',
    kafka_topic_list = 'flag-audit-log', kafka_format = 'JSONAsString',
    kafka_num_consumers = 3;

-- 4. Materialized view: auto-parse JSON → flag_audit_log
CREATE MATERIALIZED VIEW flag.mv_kafka_to_flag_audit_log
  TO flag.flag_audit_log AS SELECT ... JSONExtract*(message)
Init command:
docker exec -i flag-clickhouse clickhouse-client < deploy/scripts/clickhouse-init.sqlEnd-to-end test covering all services:
| Step | Test | What It Verifies |
|---|---|---|
| 1/11 | Health Check | All 5 services respond UP |
| 2/11 | Create Apps | App creation + duplicate handling |
| 3/11 | Create Flags | 3 baseline flags (full rollout, gradual, disabled) |
| 4/11 | Complex Rules | 2 flags with multi-rule + all-6-operators |
| 5/11 | Evaluate Complex | Rule matching with various user profiles |
| 6/11 | CDN Publish | CDN manifest + rules serving + safe_for_client filter |
| 7/11 | EvalService Sync | Flag count after Pub/Sub propagation |
| 8/11 | Baseline Eval | Single + batch evaluation correctness |
| 9/11 | Ingest Metrics + Audit | Metrics + audit log reporting via ingest API |
| 10/11 | ClickHouse Verify | Worker health + data persistence |
| 11/11 | Toggle + Cleanup | Enable/disable toggle, delete cascade |
python3 deploy/scripts/integration-test.py
# Expected: 51 PASSED / 0 FAILEDPlaywright-based browser automation testing the Web SDK demo page:
| Step | Test |
|---|---|
| 1/7 | CDN contains all 7 flags |
| 2/7 | Multi-rule: US+pro+admin → matched |
| 3/7 | Multi-rule: CN+free+guest → no match |
| 4/7 | All-ops: US+enterprise+200 → true |
| 5/7 | All-ops: CN+free+75+banned → false |
| 6/7 | Toggle quick-export OFF/ON via eval API |
| 7/7 | Browser visual: SDK loads, export button responds to toggle |
Requires Playwright with Chromium:
pip3 install playwright
playwright install chromium
python3 deploy/scripts/e2e-playwright.pyQuick health check for all services:
bash deploy/scripts/health-check.shAccess: http://localhost:33000 (admin/admin123)
Feature Flag Metrics Dashboard (flag-metrics-dashboard)
| Panel | Data Source | Query |
|---|---|---|
| Evaluation Count per Flag | ClickHouse flag_hit_metrics |
Time-series: eval_count by flag_key |
| True Hit Rate % | ClickHouse flag_hit_metrics |
Time-series: hits/eval_count ratio |
| Top 10 Flags (1h) | ClickHouse flag_hit_metrics |
Bar gauge: eval_count last hour |
| User Hit Trace | ClickHouse flag_audit_log |
Table: evaluation trails with rule/match info |
| Eval Latency (ms) | ClickHouse flag_audit_log |
Time-series: avg eval_cost_ms by flag |
| Variable | Default | Service(s) | Purpose |
|---|---|---|---|
| DB_HOST | flag-postgres | admin, eval | PostgreSQL host |
| DB_PORT | 5432 | admin, eval | PostgreSQL port |
| DB_PASSWORD | postgres | admin, eval | PostgreSQL password |
| REDIS_HOST | flag-redis | all | Redis host |
| REDIS_PORT | 6379 | all | Redis port |
| KAFKA_HOST | flag-kafka | ingest, worker | Kafka host |
| KAFKA_PORT | 9092 | ingest, worker | Kafka port |
| CLICKHOUSE_HOST | flag-clickhouse | worker | ClickHouse host |
| CLICKHOUSE_PORT | 8123 | worker | ClickHouse HTTP port |
| CLICKHOUSE_PASSWORD | dev123 | worker | ClickHouse password |
| CDN_ROOT | /cdn_root | admin-api | CDN snapshot output directory |
| LOG_LEVEL | INFO | all | Log level |