




An AI system that predicts electricity consumption in real time using Machine Learning. It calculates energy wastage, detects peak hours, and fires smart alerts — supporting smart cities, power companies, and green energy goals.
- Power grids fail to balance supply and demand → blackouts
- Buildings use energy inefficiently → wastage and high bills
- No forecasting = overuse of fossil fuels → carbon emissions
- Manual monitoring is slow and error prone → delayed response
Google • Microsoft • Tesla • Siemens • Schneider Electric • TCS • Infosys • Wipro • Tata Power • Accenture
| Tool | Purpose |
|---|---|
| Python 3.11 | Core language |
| Pandas & NumPy | Data processing |
| Scikit-learn | MLP Neural Network |
| Matplotlib & Seaborn | Visualization |
| Flask | REST API |
| Streamlit | Interactive dashboard |
| Joblib | Model saving |
- Source: Kaggle — Hourly Energy Consumption by Rob Mulla
- Size: 145,000+ hourly records (16+ years of real data)
- Unit: Megawatts (MW)
- Link: Kaggle Dataset
Raw Data → Cleaning → Feature Engineering → Model Training → Forecasting → API → Dashboard
AI-Energy-Forecasting/
│
├── 📁 data/
│   ├── energy.csv                    ← original raw dataset
│   ├── energy_clean.csv              ← sorted and cleaned
│   └── energy_featured.csv           ← 8 ML features added
│
├── 📁 notebooks/
│   ├── 01_data_exploration.ipynb     ← EDA and visualization
│   ├── 02_feature_engineering.ipynb  ← feature extraction
│   ├── 03_model_training.ipynb       ← model training
│   └── 04_forecasting.ipynb          ← 7 day forecast
│
├── 📁 models/
│   ├── energy_forecast_model.pkl     ← trained MLP model
│   └── scaler.pkl                    ← fitted scaler
│
├── 📁 outputs/
│   ├── predictions.csv               ← 7 day forecast
│   └── evaluation_metrics.txt        ← MAE, RMSE, R²
│
├── 📁 images/                        ← all generated graphs
├── 📁 src/                           ← Python modules
├── 📁 docs/                          ← documentation
│
├── app.py                            ← Flask REST API
├── streamlit_app.py                  ← Streamlit dashboard
├── main.py                           ← main pipeline
├── run_dashboard.bat                 ← one click launcher
├── requirements.txt                  ← dependencies
└── .gitignore
# Clone the repository
git clone https://github.com/YOUR_USERNAME/AI-Energy-Forecasting.git
cd AI-Energy-Forecasting

# Create virtual environment
py -3.11 -m venv venv
venv\Scripts\activate

# Install dependencies
pip install -r requirements.txt# Run main pipeline
python main.py
# Start dashboard
streamlit run streamlit_app.py
# Start Flask API
python app.py| Metric | Value |
|---|---|
| MAE | YOUR_MAE MW |
| RMSE | YOUR_RMSE MW |
| R² Score | YOUR_R2 |
| Training Size | 116,158 records |
| Testing Size | 29,040 records |
| Features Used | 8 features |
| Forecast Range | 7 days ahead |
The model uses 8 inputs:
Time features: hour • day of week • month • quarter • is weekend
Lag features: energy 1 hour ago • 24 hours ago • 1 week ago
Everything is compared against the dataset average baseline of 32,080 MW to calculate wastage and trigger alerts.
- ⚡ Real time energy prediction
- 💡 Wastage calculation vs historical average
- 🔴 Peak / Normal / Off-Peak hour detection
⚠️ Smart alerts for high consumption- 📈 Interactive charts — hourly, daily, monthly
- 📂 Raw dataset explorer with filters
- 🎯 Live model performance metrics


- Real world time series data processing
- Feature engineering and lag features
- MLP Neural Network for regression
- Model evaluation — MAE, RMSE, R²
- REST API development with Flask
- Interactive dashboard with Streamlit
- End to end ML project development
- Use LSTM deep learning for better accuracy
- Add weather data as additional feature
- Deploy on AWS or Heroku
- Add real time data streaming
- Build mobile app version
- Add anomaly detection system
| Name | Sonia Thakur |
| soniathakursonia068@gmail.com | |
| https://www.linkedin.com/in/sonia-thakur-6ab93b349/ | |
| GitHub | https://github.com/Sonia068 |
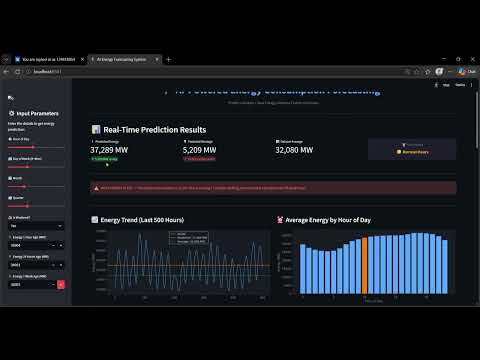
👉 Click here to watch the full demo
⚡ Built with Python • Scikit-learn • Flask • Streamlit
Supporting Smart Cities • Green Energy • Net Zero Goals