This is a demo application of WinUI SfLinearGauge control. The minimal set of required properties have been configured in this project to get started with SfLinearGauge in WinUI.
This sample demonstrates how to create a WinUI Linear Gauge with axes, ranges, and pointers. The gauge visualizes data on a linear scale with customizable ranges and pointers to indicate values.
Add reference to Syncfusion.Gauge.WinUI NuGet and import the control namespace Syncfusion.UI.Xaml.Gauges in XAML or C# to initialize the control.
<Window
    .....
    xmlns:gauge="using:Syncfusion.UI.Xaml.Gauges">

    <gauge:SfLinearGauge />

</Window>using Syncfusion.UI.Xaml.Gauges;
namespace LinearGaugeGettingStartedDesktop
{
public sealed partial class MainWindow : Window
{
public MainWindow()
{
InitializeComponent();
SfLinearGauge gauge = new SfLinearGauge();
this.Content = gauge;
}
}
}LinearAxis is used to set the range of the gauge. The Axis property of the gauge is used to initialize the axis for the gauge.
<gauge:SfLinearGauge>

      <gauge:SfLinearGauge.Axis>
           <gauge:LinearAxis Minimum="0" Maximum="140"/>
      </gauge:SfLinearGauge.Axis>

</gauge:SfLinearGauge>SfLinearGauge gauge = new SfLinearGauge();
LinearAxis axis = new LinearAxis();
axis.Minimum = 0;
axis.Maximum = 140;
gauge.Axis = axis;Ranges contain a list of range elements, where you can add any number of ranges inside the axis. You can specify the start value, end value, and background color for the range using the StartValue, EndValue, and Background properties, as demonstrated in the following code sample.
<gauge:SfLinearGauge>
    <gauge:SfLinearGauge.Axis>
        <gauge:LinearAxis Maximum="140"
                          Interval="10">
            <gauge:LinearAxis.Ranges>
                <gauge:LinearGaugeRange StartValue="0"
                                        EndValue="50"
                                        Background="Red" />
                <gauge:LinearGaugeRange StartValue="50"
                                        EndValue="100"
                                        Background="Orange" />
                <gauge:LinearGaugeRange StartValue="100"
                                        EndValue="140"
                                        Background="Green" />
            </gauge:LinearAxis.Ranges>
        </gauge:LinearAxis>
    </gauge:SfLinearGauge.Axis>
</gauge:SfLinearGauge>SfLinearGauge gauge = new SfLinearGauge();
//Adding axis to the gauge
LinearAxis axis = new LinearAxis();
axis.Maximum = 140;
axis.Interval = 10;
gauge.Axis = axis;
//Adding ranges to the gauge
LinearGaugeRange range1 = new LinearGaugeRange();
range1.StartValue = 0;
range1.EndValue = 50;
range1.Background = new SolidColorBrush(Colors.Red);
gauge.Axis.Ranges.Add(range1);
LinearGaugeRange range2 = new LinearGaugeRange();
range2.StartValue = 50;
range2.EndValue = 100;
range2.Background = new SolidColorBrush(Colors.Orange);
gauge.Axis.Ranges.Add(range2);
LinearGaugeRange range3 = new LinearGaugeRange();
range3.StartValue = 100;
range3.EndValue = 140;
range3.Background = new SolidColorBrush(Colors.Green);
gauge.Axis.Ranges.Add(range3);Bar pointers contain a list of bar pointer elements, where you can add any number of bar pointers inside the axis to indicate the value.
<gauge:SfLinearGauge>
    <gauge:SfLinearGauge.Axis>
        <gauge:LinearAxis Maximum="140"
                          Interval="10">

            <gauge:LinearAxis.BarPointers>
                <gauge:BarPointer Value="90" />
            </gauge:LinearAxis.BarPointers>
        </gauge:LinearAxis>
    </gauge:SfLinearGauge.Axis>
</gauge:SfLinearGauge>SfLinearGauge gauge = new SfLinearGauge();
//Adding axis to the gauge
LinearAxis axis = new LinearAxis();
axis.Maximum = 140;
axis.Interval = 10;
gauge.Axis = axis;
//Adding bar pointer to the gauge
BarPointer barPointer = new BarPointer();
barPointer.Value = 90;
gauge.Axis.BarPointers.Add(barPointer);MarkerPointers contain a list of pointer elements, where you can add any number of gauge pointers, such as LinearShapePointer and LinearContentPointer, inside the axis to indicate the value.
The shape pointer is used to highlight current values by using the different types of shape pointers.
<gauge:SfLinearGauge>
    <gauge:SfLinearGauge.Axis>
        <gauge:LinearAxis Maximum="140"
                          Interval="10">

            <gauge:LinearAxis.MarkerPointers>
                <gauge:LinearShapePointer Value="90"
                                          VerticalAnchor="End"
                                          OffsetPoint="0,-8" />
            </gauge:LinearAxis.MarkerPointers>
        </gauge:LinearAxis>
    </gauge:SfLinearGauge.Axis>
</gauge:SfLinearGauge>SfLinearGauge gauge = new SfLinearGauge();
//Adding axis to the gauge
LinearAxis axis = new LinearAxis();
axis.Maximum = 140;
axis.Interval = 10;
gauge.Axis = axis;
//Adding shape pointer to the gauge
LinearShapePointer shapePointer = new LinearShapePointer();
shapePointer.Value = 90;
shapePointer.VerticalAnchor = GaugeAnchor.End;
shapePointer.OffsetPoint = new Point(0, -8);
gauge.Axis.MarkerPointers.Add(shapePointer);Content pointer is used to highlight values using an image, icon, text, or any other custom view.
<gauge:SfLinearGauge>
    <gauge:SfLinearGauge.Axis>
        <gauge:LinearAxis Maximum="140"
                          Interval="10">
            <gauge:LinearAxis.MarkerPointers>
                <gauge:LinearContentPointer Value="90"
                                            VerticalAnchor="End"
                                            OffsetPoint="0,-28">
                    <gauge:LinearContentPointer.Content>
                        <TextBlock Text="90%" />
                    </gauge:LinearContentPointer.Content>
                </gauge:LinearContentPointer>
            </gauge:LinearAxis.MarkerPointers>
        </gauge:LinearAxis>
    </gauge:SfLinearGauge.Axis>
</gauge:SfLinearGauge>SfLinearGauge gauge = new SfLinearGauge();
//Adding axis to the gauge
LinearAxis axis = new LinearAxis();
axis.Maximum = 140;
axis.Interval = 10;
gauge.Axis = axis;
//Adding content pointer to the gauge
LinearContentPointer contentPointer = new LinearContentPointer();
contentPointer.Value = 90;
contentPointer.VerticalAnchor = GaugeAnchor.End;
contentPointer.OffsetPoint = new Point(0, -28);
contentPointer.Content = new TextBlock { Text = "90%" };
gauge.Axis.MarkerPointers.Add(contentPointer);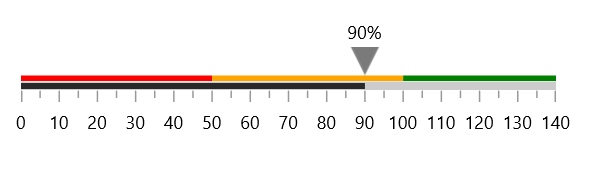
For more details please refer this ug LinearGauge.