







A full-stack analytics platform for managing a 120-vendor portfolio across performance, financials, risk, and compliance — built with a supervised churn model, backtested forecasting, statistical hypothesis testing, and cohort/funnel analysis on a realistic 24-month demo dataset.
Every model in this project reports honest, validated metrics. The churn classifier publishes its held-out ROC-AUC. The forecaster must beat a naive baseline in a rolling-origin backtest before it earns a place on the dashboard. Null statistical findings stay on the board alongside significant ones — because "spend doesn't buy ROI" is a finding, not a failure.

The main dashboard displays portfolio-wide KPIs at a glance — total vendors, active vendor count, average performance score, high-risk flags, total contract value, and cost savings. The Top Vendors by Contract Value chart is color-coded by risk level, alongside a 24-month Performance Trend line chart.
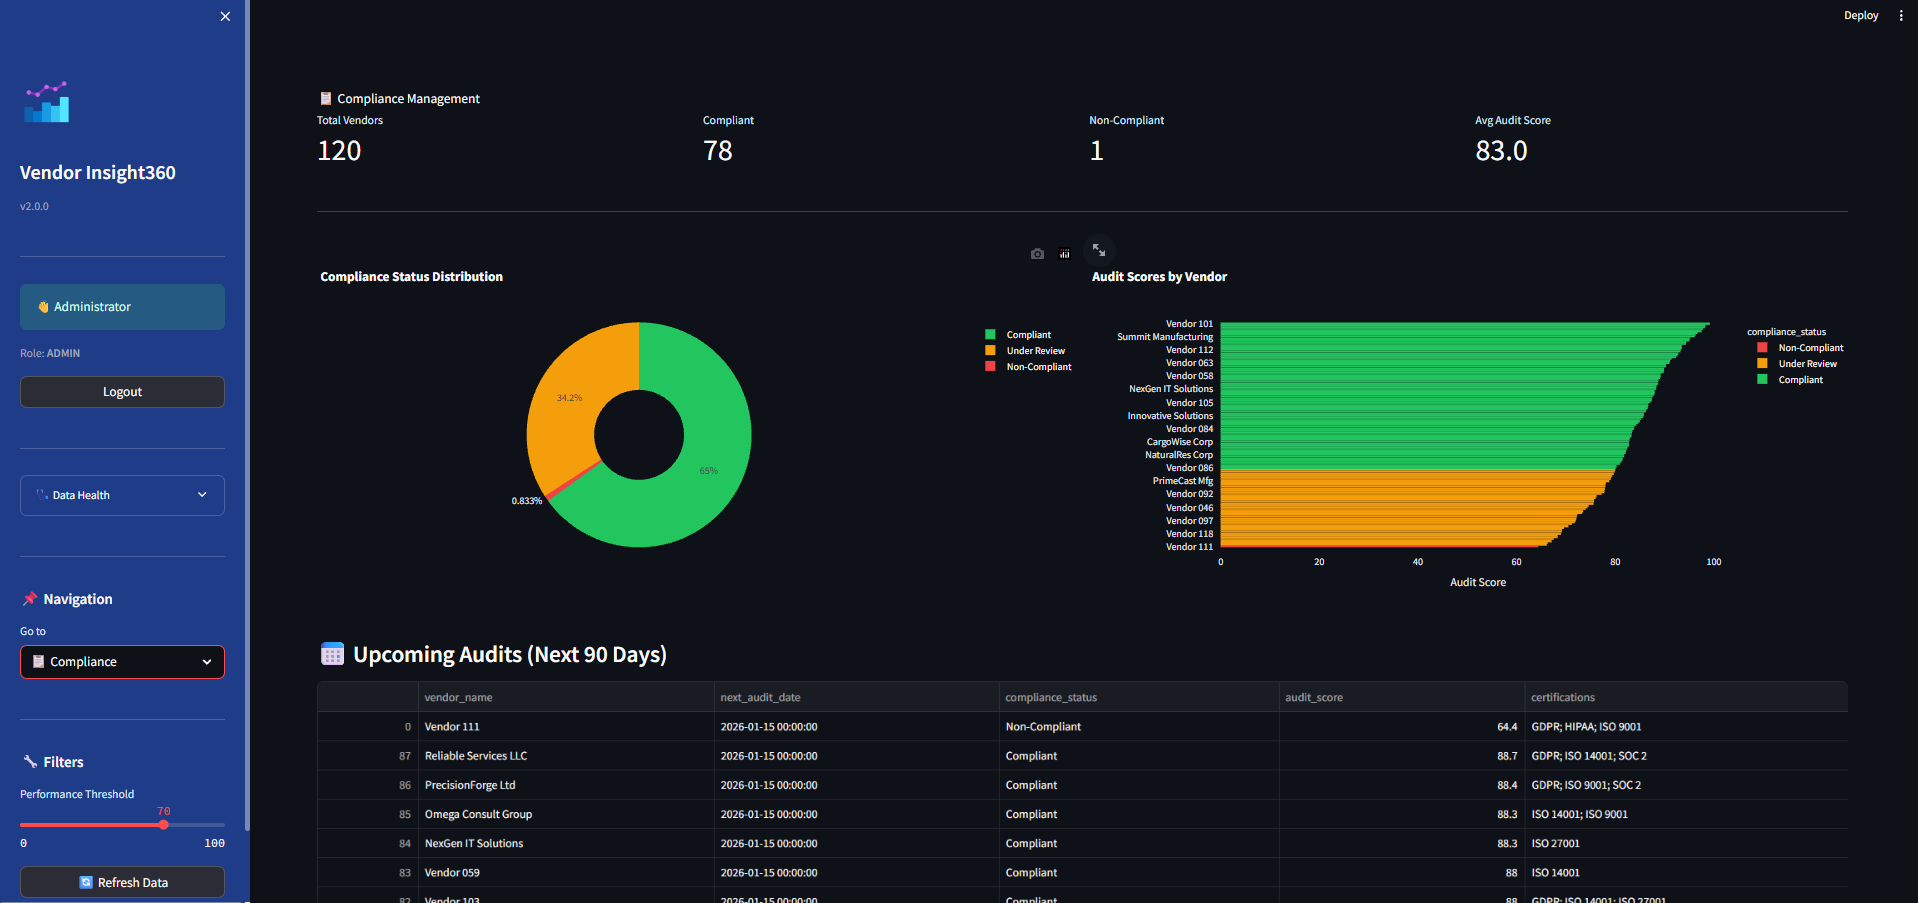
Tracks compliance status across all 120 vendors with a donut chart breakdown (Compliant / Under Review / Non-Compliant), per-vendor audit scores, and an Upcoming Audits table showing the next 90 days of scheduled reviews with certifications (GDPR, HIPAA, ISO 9001, SOC 2).
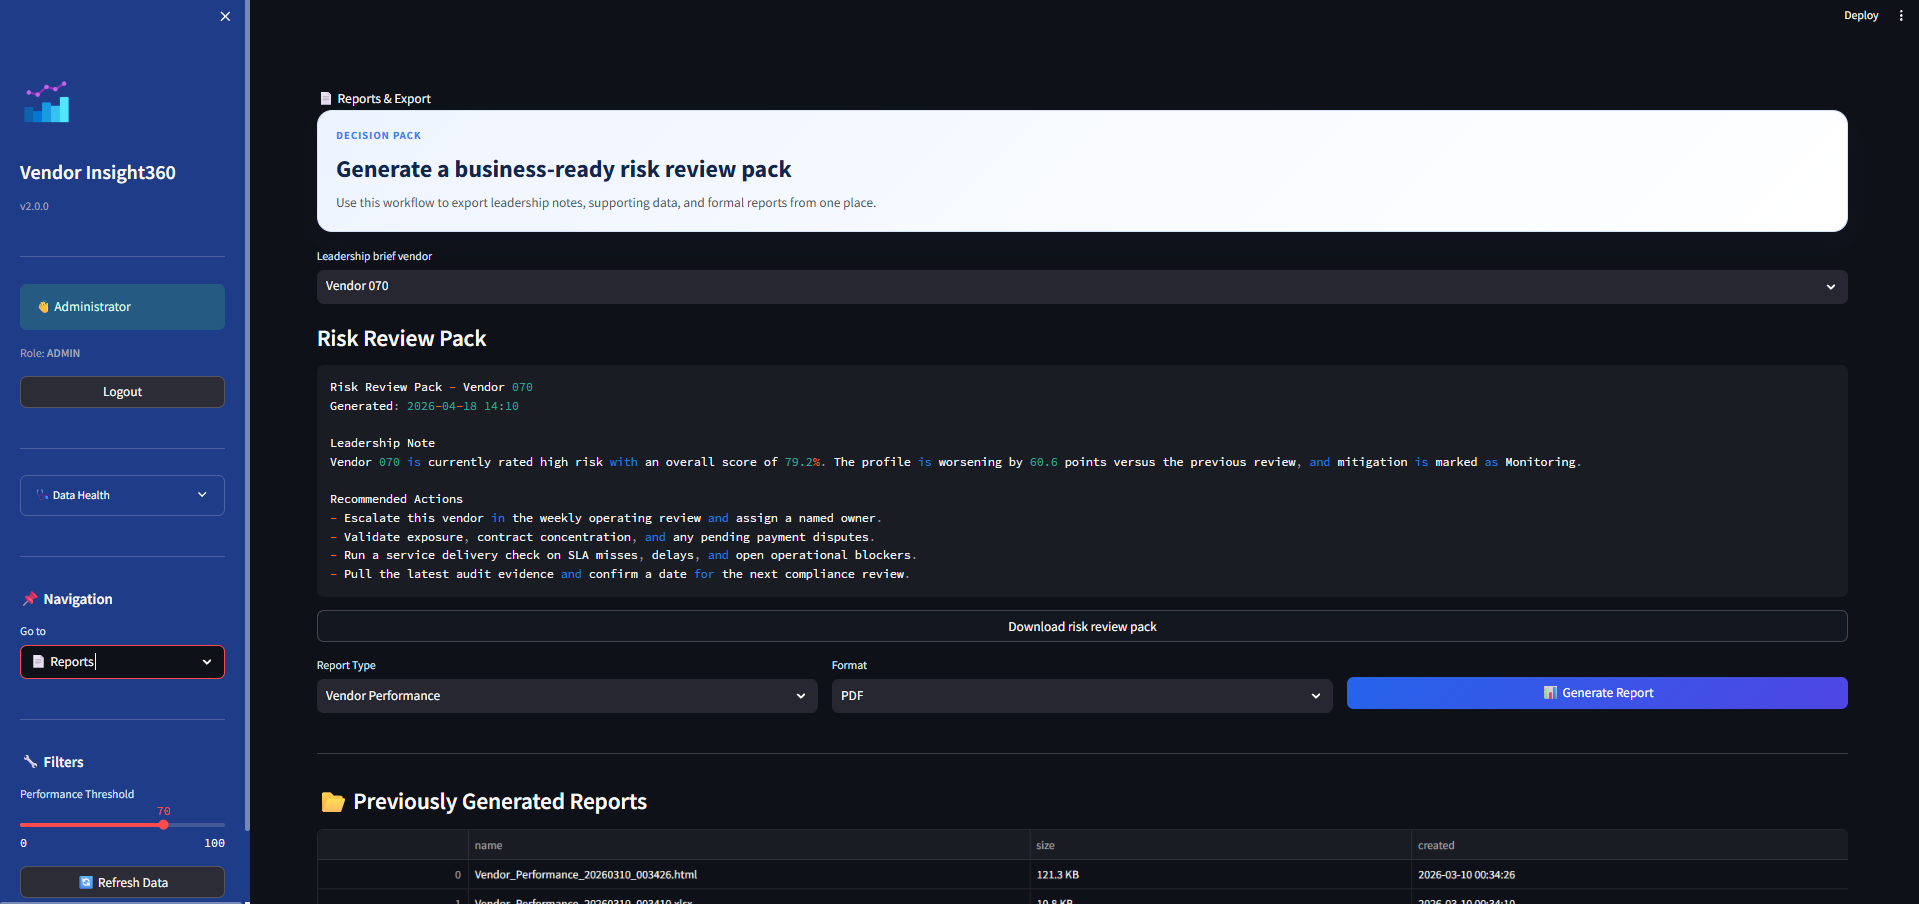
Generates a business-ready Decision Pack for leadership review — including a narrative leadership brief, recommended actions, and downloadable reports in PDF or Excel format. Previously generated reports are listed with file size and creation timestamp.
| Capability | Method | Validation |
|---|---|---|
| Churn Prediction | Logistic Regression / Gradient Boosting; features from quarter t, target from t+1 (leakage-safe); GroupKFold CV by vendor | Test ROC-AUC 0.73 vs 1.7% base rate |
| Performance Forecasting | Holt-Winters (damped trend + seasonality) with rolling-origin backtest | MAPE 0.67% vs naive baseline 0.87% |
| Statistical Insights | Welch's t-test, chi-squared, one-way ANOVA, Pearson — all with effect sizes | e.g. escalations ↘ renewals (p<.001, V=0.15) |
| Cohort & Retention Analysis | Initial-performance-quartile cohorts, survival matrices, lifecycle funnel | Early performance predicts long-term retention |
| Vendor Segmentation | K-Means with standardised features; k chosen by silhouette score | "Watch List" = high spend + low performance |
| Business Impact | Churn-probability-weighted contract value | Top-10 at-risk vendors quantified in $ exposure |
| Analytical SQL | 10 window-function/CTE queries (LAG, RANK, NTILE, rolling frames) | All verified against the bundled SQLite DB |
vendor-insight360/
├── app.py                      # Streamlit dashboard (entry point)
├── ai_integration.py           # AI assistant with safe local fallback chain
├── core_modules/
│   ├── analytics.py            # KPI aggregation
│   ├── churn_model.py          # Supervised churn classifier (leakage-safe)
│   ├── forecasting.py          # Backtested Holt-Winters forecasting
│   ├── stats_tests.py          # Hypothesis tests with effect sizes
│   ├── cohort_analysis.py      # Cohorts, retention & lifecycle funnel
│   ├── vendor_clustering.py    # K-Means segmentation (silhouette k)
│   ├── database.py             # SQLite + CSV data access layer
│   ├── auth.py                 # PBKDF2 password hashing, JWT tokens
│   └── config.py               # Environment-driven configuration
├── ui_pages/                   # Dashboard pages (AI, risk, reports, analytics lab…)
├── enhancements/               # Report generator, anomaly detection, extras
├── api/                        # Flask REST API (JWT-protected)
├── sql/analytical_queries.sql  # Portfolio of analytical SQL queries
├── Data layer/                 # Demo CSVs (120 vendors × 24 months) + SQLite DB
├── automation/                 # Alert monitor & report scheduler scripts
├── web/                        # Static assets & templates
└── tests/                      # Pytest suite (incl. leakage checks & backtest assertions)
# Clone the repository
git clone https://github.com/Helloworld880/Vendor-Insight-360.git
cd Vendor-Insight-360

# Set up a virtual environment
python3 -m venv .venv && source .venv/bin/activate

# Install dependencies
pip install -r requirements.txt

# Launch the dashboard
streamlit run app.py
Login credentials are shown on the login screen and are configurable via .env (see core_modules/config.py).
pytest -q # 20 tests including leakage checks and backtest assertionsThe AI workspace runs in mock mode out of the box. For live LLM responses:
# Local (free) — install Ollama, then:
export AI_MODE=ollama

# Anthropic API:
pip install anthropic
export AI_MODE=real ANTHROPIC_API_KEY=sk-ant-...python automation/scripts/alert_monitor.py --dry-run # Threshold-based alerts
python automation/scripts/report_scheduler.py --run # Daily/weekly report schedulerChurn is a rare event (~1.7% of vendor-quarters). The model card reports ROC-AUC and PR-AUC against that base rate — never raw accuracy. Class-weighted probabilities are for ranking vendors, not calibrated likelihoods, and the UI makes this explicit.
Churn features come strictly from the quarter before the outcome. Cross-validation folds are grouped by vendor so no vendor straddles train and validation sets.
The dashboard shows the model's rolling-origin backtest MAPE next to a last-value baseline. If the model ever loses, you'll see it.
Every hypothesis test reports Cramér's V, Cohen's d, η², or r — and non-significant results are displayed, because a null finding is still a finding.
All demo contracts share a start date, so join-date cohorts would be degenerate. Vendors are cohorted by initial performance quartile instead: "do strong starters stay longer?"
| Layer | Technology |
|---|---|
| Dashboard | Python · Streamlit · Plotly |
| ML / Stats | scikit-learn · statsmodels · SciPy |
| Data | SQLite · Pandas |
| API | Flask (JWT-authenticated) |
| Testing | Pytest |
| Auth | PBKDF2 password hashing · JWT |
Yash Dudhani — github.com/Yashdudhani
This project is licensed under the MIT License — see the LICENSE file for details.