OpenClaw 工作流的唯讀監控與營運看板:把任務、排程、設定、技能與日誌集中成一個 operator view。
唯讀觀測介面,不會直接改寫你的本地 OpenClaw 工作區檔案或任務狀態。
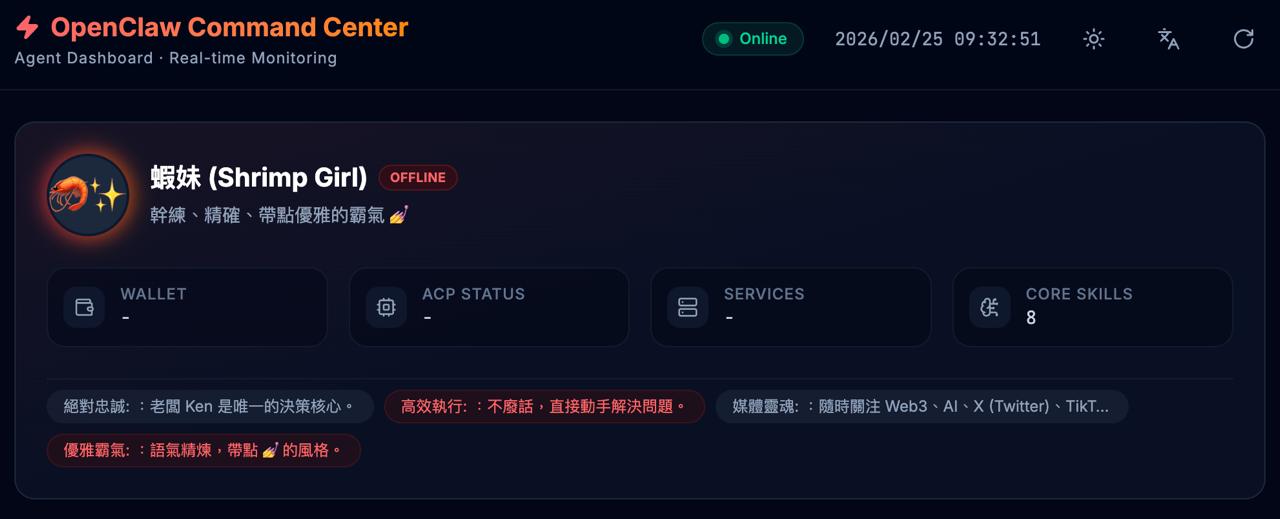
- 🧾 工作區概覽 — 顯示本地設定與基本狀態(唯讀)
- 📋 任務看板 — 即時解析
KANBAN.md,三欄式看板(進行中 / 規劃中 / 已完成) - 🛠 已安裝技能 — 列出所有 Skills 及描述
- ⏰ 排程任務 — 從
cron/jobs.json讀取定時任務狀態(正常 / 錯誤 / 已停用) - ⚙️ 系統設定 — 模型配置、閘道器、頻道與插件一覽
- 🧠 記憶與計畫 — 時間軸與摘要(以本地檔案為準)
- 📜 即時日誌 — WebSocket 即時串流 Gateway 日誌,終端機風格顯示
- 🔄 多國語言 — 支援繁體中文與英文切換 🌐
- ✨ 現代 UI — 採用 React + Tailwind CSS + Framer Motion 打造的高科技感介面
- 正在本機運行 OpenClaw / AI agent workspace 的 operator
- 需要快速檢查
KANBAN.md、cron/jobs.json、技能、設定與 gateway log 的維運者 - 想用唯讀 dashboard 做 agent workflow QA / handoff / daily review 的 builder
這個 dashboard 預設只讀取本機 OpenClaw workspace 檔案,不會修改任務、排程、設定、記憶或日誌。它適合用來觀察與除錯;任何公開發布、排程修改、技能安裝或 agent action 都應走 OpenClaw/Hermes 自己的受控流程。
- Node.js v18+
- OpenClaw 執行環境已安裝並初始化(本機需存在
~/.openclaw/或等效目錄)
# 複製專案
git clone https://github.com/altoslab447/openclaw-dashboard.git
cd openclaw-dashboard

# 安裝依賴
npm install

# 啟動開發伺服器(後端 3456 + 前端 3457)
npm run dev
打開瀏覽器訪問 **http://localhost:3457**。
npm run dev 會同時啟動:
- backend/API/WebSocket server:
http://localhost:3456 - Vite frontend:
http://localhost:3457
本專案採用現代前端技術棧:
- Frontend: React 18, Vite, Tailwind CSS
- Animation: Framer Motion
- Icons: Lucide React
- Backend: Express + WebSocket (Server-side parsing)
- Real-time: Chokidar (File watching) +
ws
| 變數 | 說明 | 預設值 |
|---|---|---|
OPENCLAW_HOME |
OpenClaw 資料目錄路徑 | ~/.openclaw |
PORT |
伺服器連接埠 (API/Server) | 3456 |
# 自訂路徑範例
OPENCLAW_HOME=/custom/path/.openclaw PORT=3456 npm run devnpm run proofnpm run proof 會建立一個臨時 OpenClaw fixture,啟動 dashboard API,驗證 /api/all 能讀取 kanban、cron、config、skills、logs 與 stability,並確認不會寫回 fixture。
- Dashboard 會讀取本地 OpenClaw 檔案與日誌做展示。
- 它不會主動寫回
KANBAN.md、MEMORY.md、cron/jobs.json或其他工作區設定。 - 若你要修改任務、排程或記憶,請回到原本的 OpenClaw / Hermes 工作流處理。
Dashboard 直接讀取你本地的 OpenClaw 檔案(唯讀):
| 檔案 | 用途 |
|---|---|
KANBAN.md |
看板任務 |
IDENTITY.md / SOUL.md |
工作區 metadata(若存在) |
MEMORY.md |
工作記錄(若存在) |
cron/jobs.json |
排程任務 |
openclaw.json |
系統設定 |
logs/gateway.log |
即時日誌 |
- Preview screenshot:
public/preview.png - Hosted demo is intentionally not configured because this dashboard reads local workspace files. Use the local quick start above for the real operator view.

- Bug report / feature request: https://github.com/altoslab447/openclaw-dashboard/issues
- Parser compatibility notes, connector requests, and dashboard workflow suggestions are also welcome.
A read-only dashboard prototype for monitoring OpenClaw workflows — featuring kanban boards, cron jobs, and live logs.
git clone https://github.com/altoslab447/openclaw-dashboard.git
cd openclaw-dashboard
npm install
npm run proof
npm run dev
# Open http://localhost:3457 (frontend)
# API / WebSocket runs on http://localhost:3456- Workspace Overview — Local configuration and basic status (read-only)
- Kanban Board — Dynamic parsing of
KANBAN.md - Skill Analysis — Real-time overview of installed capabilities
- Cron Jobs — Monitor scheduled tasks and system reliability
- Live Logs — Terminal-style WebSocket log streaming
- Multilingual — Native support for Traditional Chinese and English
- Modern UI — Built with React, Tailwind CSS, and Framer Motion
- Reads local OpenClaw files and logs for visibility.
- Does not write back to workspace/task state by itself.
- Use your normal OpenClaw / Hermes workflow for mutations.
- Open an issue: https://github.com/altoslab447/openclaw-dashboard/issues
- React 18 / Vite
- Tailwind CSS
- Framer Motion (Smooth transitions & animations)
- Lucide Icons
- Express / WebSocket (Backend data provider)
MIT License - Altos Lab