



PDF generation made easier, on top of reportlab and platypus.
A cursor that moves down the page, with the reportlab canvas still at hand to
draw exactly where you want on the page.
pip install reportlab_layoutfrom reportlab_layout import PDFMaker
with PDFMaker("report.pdf", top=25, auto_page_break=True) as doc:
doc.set_footer(doc.make_paragraph("Acme Ltd", "Right"))
doc.draw_paragraph("Third-term report", "Heading1 Centered")
doc.draw_centered_line(wscale=0.4)
doc.add_space()
doc.draw_table([["Subject", "Mark"], ["Mathematics", "17"]])
# And right there, without switching tool or file:
doc.draw_round_rect(doc.x_left, doc.cursor_y - 40, doc.content_width, 40, radius=6, fill="#eef4fb")
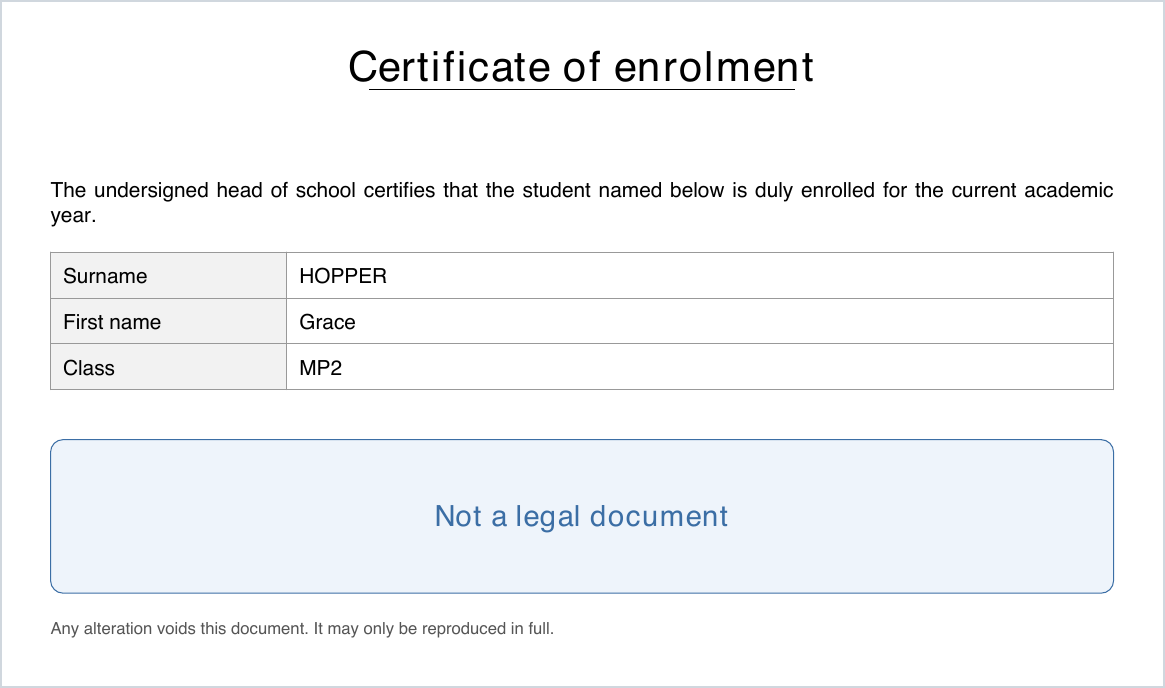
doc.draw_string("Distinction", *doc.cursor_point, halign="left", valign="cap")A page drawn by
examples/certificate.py:
the title, the paragraph and the table flow down the page; the callout is drawn
on the canvas where the cursor stands, its label centred on the cap height, and
the flow resumes below it.
reportlab gives you two ways to work, and they do not mix well.
The canvas draws wherever you tell it, in points, from the bottom-left corner. Precise, but you hold the current position yourself, you recompute heights by hand, and one line inserted in the middle shifts everything after it.
Platypus threads flowables through frames and handles flow, pagination and
table splitting. But it takes over the page: to draw a box behind a paragraph at
an exact point you have to go through a BaseDocTemplate's onPage callbacks,
which means writing the layout in two separate places and out of order.
This package keeps platypus flowables but lays them down itself, at the position
of a cursor you can read, move and question at any time. The canvas stays
reachable through doc.canvas. The two modes mix line by line.
doc.draw_paragraph("This paragraph moves the cursor down.")  # flow
y = doc.cursor_y                                             # current position
doc.draw_rect(doc.x_left, y - 30, doc.content_width, 30)     # absolute
doc.advance(30) # the cursor follows- An explicit cursor.
doc.cursor.depth,doc.cursor_y,doc.remaining_height,doc.advance(h). No magic: you always know where you are on the page. - One method for plain text.
draw_string(text, x, y, halign=…, valign=…, scale=…, angle=…)replaces the half-dozen variants everyone ends up writing, and the vertical centring is right — including thecapanchor that centres short labels on their capitals, which is what a table cell or a badge actually wants. Seemiddleorcap? - One uniform return. Every drawing call returns a
Box(x, y, width, height)that unpacks as a plain 4-tuple. You know what you just laid down, and where. - The two coordinate systems kept apart. The canvas ordinate goes up, the
cursor depth goes down;
PageGeometryis the only place that converts. - Nothing leaks. Every drawing is wrapped in
saveState/restoreState, so a colour or a line width never contaminates the next call. - What a report needs and reportlab lacks. Columns that carry on from page
to page and end level, as LaTeX's
multicolsdoes; TrueType families whose bold and italic work in markup; images set on the baseline, for formulas typeset elsewhere; a tag flush right on the last line of a paragraph. - Nothing falls off the page. A block taller than the page splits from the
cursor over as many pages as it takes, a table between two rows with its
heading repeated; one that cannot split starts a fresh page and says so in the
log.
canvasmaker=NumberedCanvasnumbers the pages "x of y" in one pass. - Two dependencies, reportlab and Pillow. No headless browser, no LaTeX, no system binary.
| Tool | Model | System deps | Licence | Status (September 2026) |
|---|---|---|---|---|
| reportlab canvas | absolute, points | no | BSD | 5.0.1, very active |
| reportlab platypus | flow, flowables | no | BSD | same |
reportlab_layout |
cursor + canvas | no | MIT | this package |
| fpdf2 | native cursor | no | LGPL-3.0 | 2.8.8, very active |
| pdfino | platypus wrapper | no | MIT | 0.1.0, 2023 |
| pdfdocument | platypus wrapper | no | BSD | 4.0.0, 2020 |
| borb | object model | no | AGPL-3.0 | 3.0.9, active |
| WeasyPrint | HTML + CSS | no | BSD | 70.0, very active |
| pdfme | document as a dict | no | MIT | 0.5.0 |
| rst2pdf | reStructuredText | no | MIT | 0.105, active |
| pypdf / pikepdf | manipulation, not generation | no | BSD / MPL | active |
| pylatex, Typst, wkhtmltopdf | markup + external engine | yes | various | various |
reportlab platypus is an excellent package, and it does more than this one:
tables of contents, bookmarks, and page templates whose frames alternate from
page to page. It also splits a flowable the moment it does not fit, where this
package moves it whole and splits only what no page could hold — hand a block to
draw_columns with a single column to split it on demand. If your document is a
report that flows from start to finish, use platypus: this package has
nothing to add. The difference comes
down to one point: as soon as you need to alternate free drawing and flow in the
same gesture, platypus makes you separate the content (the story) from the
decoration (the onPage callbacks). Here, everything is written in the order it
is drawn.
fpdf2 is the fairest comparison, because it is already a cursor model —
set_xy, cell, multi_cell, ln() — and it is excellent: an HTML subset,
tables, digital signing, a lively community. Three concrete differences. Its
licence is LGPL-3.0, which is enough to rule it out in some settings; reportlab
is BSD and this package MIT. Its rich-text engine is an HTML subset, where
reportlab's Paragraph takes proper markup (<super>, <font>, subscripts,
bullets) and knows how to wrap within a given width. And its cursor is the
API: you cannot lay a reportlab flowable in the middle of it. If you are
starting from scratch and the LGPL does not bother you, fpdf2 is a very good
choice.
pdfino and pdfdocument sit in exactly the same slot: a sequential layer
on top of platypus. They are older and simpler — h1(), p(), table() — and
pdfino even lets you insert a raw flowable. What neither offers: reading and
moving the cursor explicitly, absolute placement in points within the same API,
corrected font metrics, and a Box returned from every call. They publish a
document; this one lets you build a page. Worth noting too: pdfdocument has not
released since 2020, and pdfino is at a 0.1.0 from 2023.
borb offers a complete object model and reads existing PDFs as well. It is more ambitious; it is also AGPL-3.0, a licence that reaches any service exposing it over a network. Rule it out up front in a proprietary setting.
WeasyPrint produces the finest typography of the list and handles paged CSS
(@page, running headers, breaks). The price: you have to express the layout in
HTML and CSS, and rendering goes through a full layout engine. For a document
whose geometry is computed — a yearly planner, a slot table, a grid of photos —
describing coordinates in CSS is a detour. For an invoice or a report whose
template you already have on the web, WeasyPrint wins hands down.
pdfme, rst2pdf and pylatex share one stance: describe the document in some format (a dict, reStructuredText, LaTeX) and let an engine typeset it. Excellent when the content is the subject; unsuited when the coordinates are. pylatex and Typst add a heavy system dependency on top.
pypdf and pikepdf do not generate documents: they merge, split and sign. Complementary, not competing.
| What you need | Prefer |
|---|---|
| A report that flows on its own, tables split across pages, a table of contents | reportlab platypus |
| The template already exists in HTML/CSS | WeasyPrint |
| A simple cursor, without reportlab, and the LGPL is no problem | fpdf2 |
| To publish a simple document in a handful of calls | pdfino |
| To split, merge or sign existing PDFs | pypdf, pikepdf |
| The content is marked-up text | rst2pdf, pylatex |
| A page whose geometry is computed, alternating flow and point-exact drawing | reportlab_layout |
This package fills a narrow slot, but one that turns out to come up often: documents where you know the formula that gives each element's position — planners, grids, calendars, slot tables, contact sheets, mail merges — and where you still want to write text as it comes, without counting points by hand.
docs/DOC.md— the full API reference: coordinate systems, placement, styles, metrics, fonts, inline images, frames, columns, pagination.examples/certificate.py— a one-page document, flow and absolute drawing mixed.scripts/centering_proof.py— the visual and numeric proof of the centring.
Python 3.11 to 3.14, reportlab 4.x and 5.x. The continuous-integration matrix covers each of these eight combinations.
MIT. reportlab is under a BSD licence, Pillow under MIT-CMU.