


Self-hosted, coach-grade analysis for Counter-Strike 2 demos. Every demo is parsed once into positions (16 Hz), kills, grenades and economy; from that, hundreds of features are pre-computed into database tables. After that, every question — "what does this team run on a full buy after losing a round on A?" — is a fast lookup, not a re-watch. The motto is parse once, query forever.
Everything runs on your own machine. There are no external AI services and no per-use cost: all the "smart" parts are deterministic statistics, geometry, and models trained locally on your own archive.
MIT licensed — free to use, modify and share. The UI is in English; some
internal docs (docs/mimari.md) and code comments are in Turkish.
🤖 Built end to end with Claude Code (Claude Fable 5) — from the Rust parser to the React UI.
💬 Why it's free: I was going to launch this as a subscription website and try to make some money selling monthly plans. But — what the hell. It's more fun to just put it out there. Use it, learn from it, build on it. If it helps your team, that's payment enough. If you like it, a ⭐ makes my day — and if it really helps, you can buy me a coffee ☕.
 2D replay — positions, HP/economy HUD, nade markers, ghost rounds |
 Opponent report — utility habits, setups, roles, predictions |
 Pattern Finder — grenade habits with round-clock timing |
 Moments — structured event search, one click into the replay |
 Home — 2,600+ pro matches, grouped by series, searchable |
|
1. 🌐 Browse the public archive — nothing to install. A free, read-only copy of the site with a curated pro-match archive is published on GitHub Pages:
https://benginn.github.io/csfreezetime — 2D replays, opponent reports, predictions, ML Lab and leaderboards, straight from your browser.
2. 🖥 Self-host the full studio. The public site is a static snapshot; the live-query features below need the real databases running. For those — or to build an archive from your own demos — download this repository and run it on your own machine (step-by-step setup).
| Feature | Public site | Self-hosted |
|---|---|---|
| 2D replay, match heatmaps, ghost rounds | ✅ | ✅ |
| Opponent reports, predictions, ML Lab, leaderboards, compare | ✅ | ✅ |
| Search (teams / players / tournaments / matches) | ✅ | ✅ |
| Analyze your own demo (parsed in-browser, never uploaded) | ✅ | ✅ |
| My DB — your own private demo database, with local team reports | ✅ | ✅ |
| Veto simulator (computed in-browser on the public site) | ✅ | ✅ |
| Notes & playlists (stored in your browser, export/import as a file) | ✅ | ✅ |
| Moments — structured event search (kills, grenades, bombs, economy) | ✅ per map | ✅ |
| Pattern Finder — grenade trajectory explorer | ✅ newest 20k/map | ✅ |
| Team positioning heatmaps | ✅ preset windows | ✅ free-range |
| Presence queries (players in an area), Scenarios, round overlay | — | ✅ |
| Feeding it your own demos | — | ✅ |
Nothing to install, no account:
- Open https://benginn.github.io/csfreezetime.
- Pick a match from the home page (search by team, player or tournament). The first time you open a match its replay bundle (a few MB) downloads and is cached by your browser — after that it works instantly, even offline.
- Watch the 2D replay (play/pause, speeds, kill feed, grenade arcs), switch tabs for heatmaps and ghost rounds.
- Dig into a team via ⚔ Compare, the opponent report (the 📊 link on a team), 🏆 Boards and the 🧠 ML Lab.
- Got a demo of your own? ⚡ Analyze parses it right in your browser — nothing is uploaded anywhere — and shows it as a full match page.
- 🔎 Moments searches the archive for structured events (opening kills, early flashes, B plants, eco rounds…) right in your browser — pick a map first. 🧭 Patterns explores grenade trajectories the same way. A few of the heaviest features (presence queries, Scenarios, free-range heatmap time windows, cross-match round overlays) are marked self-host only — for those, run the studio yourself (next section).
The archive is updated in batches (roughly weekly) by the maintainer.
Your own demos? The ⚡ Analyze page parses a single demo inside your browser (WebAssembly — the file never leaves your machine) and opens it as a normal match page. For a whole archive of your own demos (scrims, a private team database with reports and predictions), self-host: drop demos into
backfill/, or use My DB to keep them separate. Next section.
Clone this repo and follow Step-by-step setup. You get every feature, and the archive is whatever you feed it:
⚠️ You bring the demos. The repo ships the engine, not any match data — no demos, no database dumps. Drop your own.demfiles intobackfill/and it builds your archive (see Feeding it demos). Everything is local and private. You can even publish your own static copy of your archive (see Publishing a static copy).
📖 Prefer a narrative tour? See docs/how-it-works.md.
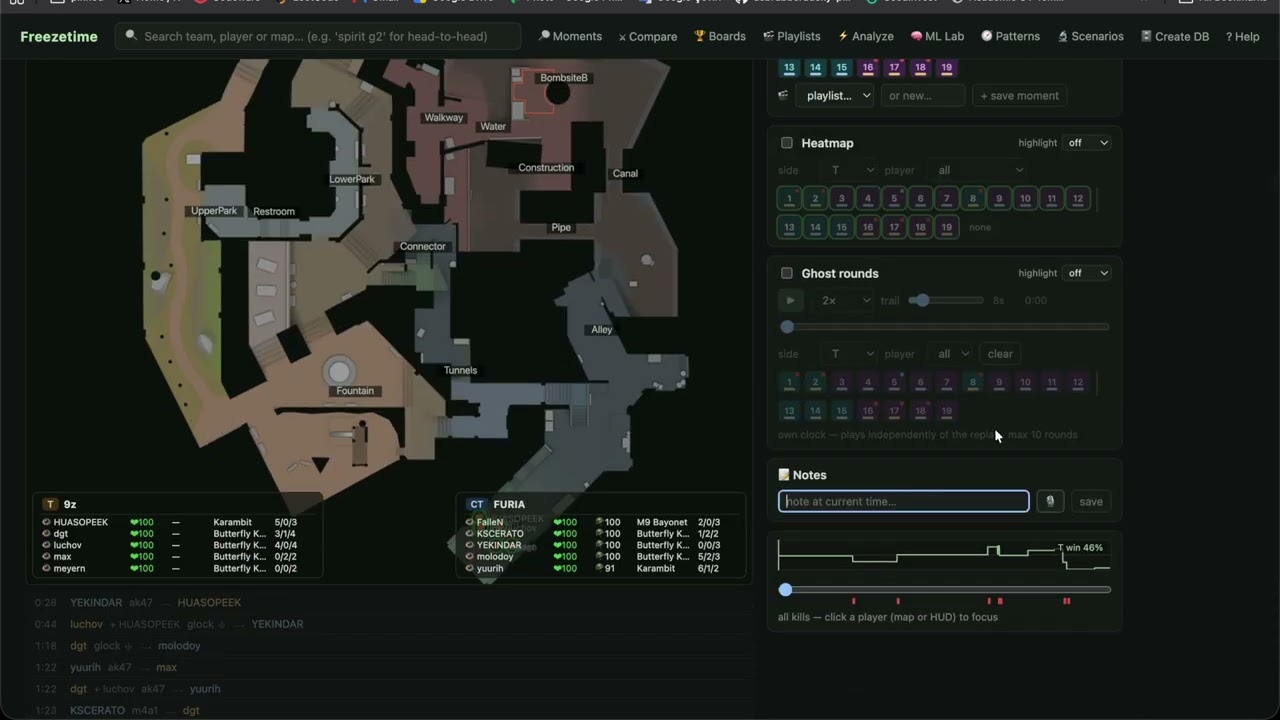
Once you've fed it some demos, the web app (http://localhost:8090) gives you:
- 2D replay. A synchronized top-down view of any round. Player dots show
facing direction, an HP ring, and a corner HUD with shield / money / inventory
plus a live kill feed. Blinded players whiten and fade back as the flash wears
off; muzzle flashes and red tracers show who is shooting whom. Play/pause,
speeds 0.25×–8×, a timeline marked with kills and events, zoom/pan, and a
drawing tool (pen + arrows, saved per round).
- Grenades: trajectories are drawn; hover an active grenade for its type, throw time and thrower, plus its flight arc. Toggle grenade types on/off (hide HE/decoy to read smokes and flashes cleanly).
- Bomb & dropped weapons: the C4 carrier wears a red dot; dropped weapons stay on the map with their name on hover.
- Focus & hide: click a player to focus the timeline on their
kills/deaths/nades, or hide players from the map with the eye button.
setposcopies their exact position and view angles as a console command for your practice server. - Round chips are colored by winner with a side stripe; the highlight picker rings rounds by buy type, by strategy, or by "who had an AWP." Chips also flag thrown rounds (a team that peaked ≥75% win probability and still lost) and surprise rounds (a strategy the model gave <15%).
- Win probability sparkline above the timeline, computed from archive history (alive counts, bomb state, clock).
- Heatmap. Football-style position density for any set of rounds you pick, one side or both, one player or everyone. Lower levels (Nuke) render in an inset.
- Ghost rounds. Overlay many rounds as translucent trails on their own clock — align at round start, bomb plant, or first kill to compare executions. Trail length slider; hover/pin a ghost for that player's live HP/economy.
- Notes & playlists. Pin text or voice notes to the exact second of a round; save moments into named playlists that auto-advance for hands-free review.
- Team page. Overall record, per-map cards with each side's signature strategy (vs the league average), a player table (matches, rounds, ADR, K/D, flash assists, survival) with current-five vs former players marked, and the match list. A free-form time window and a lineup ≥ N/5 filter narrow everything.
- Opponent report (
/report/:team) — the coach's one-pager per team & map:- Overview: map record, side round-win rates, pistols, conversion after a won pistol, rush rate, and set-strat share (rehearsed executes vs default/mid-round).
- Execute templates: utility combinations they repeat to open a site.
- Strategy tendencies: what they favor, with a ×N vs league badge; a by-buy table and a by-round-type table (pistol / after pistol / 3rd / mid-game / overtime).
- Next-round prediction: the same engine as the ML Lab, with the method and evidence shown.
- Default setups: exact player positions 15 s in, with a site notation (3A-2B), hold times, and how they rotate after first contact.
- Utility habits, boosts, and map-control → outcome ("when they take MainHall the round ends on A ×2.0").
- Thrown rounds and a player breakdown (roles, opening duels, clutches, trades). Everything respects the window/lineup filters and prints cleanly.
- Compare & veto. Two reports side by side; a veto simulator that produces rational ban/pick sequences for BO1/BO3/BO5 from both teams' map strengths.
Every grenade on a map, with the top repeated landing spots ranked for you ("smoke → TopMid ×47, usually at 1:39 ±5s"). Drag a box on the map to isolate an area, read the timing histogram, filter by team/side/player/period/type, and jump into the rounds.
Situation queries about a team: "as T on Mirage, full buy, right after losing a round on A — what do they run?" You get the historical mix in exactly that spot, how far it deviates from their normal game (×N vs usual), and real rounds to watch.
The transparency page for the prediction models: pick a team and see what the site would predict, watch six methods (from a league baseline to a LightGBM model) race on a temporal test, and see which one wins per map & side — because only the winner is ever served. Includes a strategy-cluster explorer and, where the learned model wins, what drives its decisions.
- Player pages are map-driven: pick a map and the role cards, clutches and heatmaps all focus on it. Roles (entry / lurker / anchor / AWP) come with evidence; the positioning heatmap has an AWP-only filter.
- Leaderboards: archive-wide top-20s (ADR, opening duels, clutches, flashes, trades), each stating its minimum sample.
- Moments: a structured search over every round ever parsed ("AWP kills through smoke on eco"), with presets and savable searches.
Process private demos (scrims, FACEIT, POV) in your browser without touching the main archive; the server never keeps a copy. You can compose your database with matches pulled from the public archive, and attach team voice comms that play synced to the replay. (Self-hosting? You usually just backfill demos into your own archive instead — it's your server. See below.)
Numbers are honest: every claim carries its sample size, and thin data hides itself rather than guess. 🧠 marks anything derived from the ML pipeline.
Follow these in order. Everything runs on your own machine.
0. Install the prerequisites (once). Freezetime is built from several languages, so a handful of tools must exist on your machine first. You don't need to know any of them — just install and move on:
| Tool | What it's for here |
|---|---|
| Docker (+Compose) | runs the four databases in containers |
Rust (cargo) + protoc |
builds the demo parser |
| Go 1.22+ | builds the query/API service |
| Node 18+ | builds the web UI |
Python 3.11+ + uv |
runs the stats/ML jobs |
unar (optional) |
rescues the occasional broken .rar from HLTV |
macOS — install Homebrew if you don't have it, then copy-paste:
brew install --cask docker        # or: brew install colima docker docker-compose
brew install rustup protobuf go node uv unar
rustup-init -y                    # one-time Rust setup; then reopen the terminal
Ubuntu/Debian — roughly:
sudo apt install docker.io docker-compose-v2 protobuf-compiler golang nodejs npm unar
curl --proto '=https' --tlsv1.2 -sSf https://sh.rustup.rs | sh   # Rust
curl -LsSf https://astral.sh/uv/install.sh | sh                  # uv
Check everything landed (each line should print a version, not an error):
docker --version && cargo --version && protoc --version \
  && go version && node --version && uv --version
Using Docker Desktop on macOS? Just open it once so the whale icon appears. Using colima instead?
colima start --cpu 4 --memory 8first.
Then clone the repo and cd into it:
git clone https://github.com/benginN/csfreezetime.git && cd csfreezetime1. Start the databases and message queue. This brings up PostgreSQL, ClickHouse, MinIO and NATS in Docker, then creates the database tables:
cd infra && cp .env.example .env && docker compose up -d --wait postgres clickhouse minio nats
docker compose up -d minio-init && cd ..
scripts/apply-pg-schema.sh && scripts/apply-ch-schema.sh
2. Start the four services. Open four terminals, and in each one first
load the env vars with set -a; source infra/.env; set +a, then run one of:
# terminal 1 — parser (turns demos into data)
cargo run --release --manifest-path services/parser-worker/Cargo.toml

# terminal 2 — a second parser is optional but speeds up big batches
cargo run --release --manifest-path services/parser-worker/Cargo.toml

# terminal 3 — enrichment (trades, first-kills, buy classes…)
(cd services/enrichment && uv run --no-editable enrichment-worker)

# terminal 4 — stats-svc: the API + website on http://localhost:8090
(cd services/stats-svc && go build -o stats-svc . ) && ./services/stats-svc/stats-svc
3. Build the website (stats-svc serves it from apps/web/dist):
(cd apps/web && npm install && npm run build)4. Add demos — see Feeding it demos below. This is what actually fills the site with data.
5. Open http://localhost:8090. That's it.
macOS + Colima shortcut: once set up,
scripts/start-all.shbrings the VM, databases and all four services up in one command;scripts/stop-all.shtakes them down.
Sanity checks (optional):
scripts/e2e-test.sh(pipeline end-to-end),scripts/test-dsl.sh(replay/heatmap),scripts/test-ml.sh(analysis consistency).
This is the important part — the app is empty until you give it demos.
Step 1 — find (or create) the backfill/ folder. It lives at the root of
the repo, right next to README.md, services/, apps/. If it isn't there
yet, just make it:
mkdir -p backfill # run this from the repo rootStep 2 — drop your demo files into backfill/. With the services running
(step 2 of setup), a watcher checks that folder every ~20 seconds, and for
each new file it: parses it → enriches it → adds it to your archive →
recomputes the analysis tables. No button to press. A file is only picked up
once its size stops changing between two scans, so a still-copying file safely
waits its turn.
What you can drop in backfill/:
- raw
.demfiles - archives that contain demos:
.raror.zip(as you'd download from HLTV/FACEIT) - compressed single demos:
.dem.gzor.dem.zst
Step 3 — wait, then refresh the site. Parsing a demo takes seconds to a minute or two depending on its size. As demos finish, the match total on the home page goes up. Team-level analysis (tendencies, predictions, patterns) is recomputed automatically once the queue settles.
How much do you need? Team-level intelligence only gets meaningful with a real archive — the more demos, the sharper and more trustworthy the numbers. A season or two of a team's matches is the sweet spot. Just want to look at one match? The Analyze page parses a single demo on its own, no archive required.
Where to get demos: your own GOTV recordings, FACEIT/ESEA downloads, or HLTV. Respect each source's terms — Freezetime doesn't scrape anything; you supply the files.
Work down this list — it's almost always one of these:
- Does the
backfill/folder exist and contain your files? It's at the repo root. Create it withmkdir -p backfillif missing. - Are all the services running? You need stats-svc (the watcher lives
here), at least one parser-worker, and enrichment — all up, all
started with the env loaded (
set -a; source infra/.env; set +a). - Give it ~20 seconds for the scan, plus parse time. Big demos take longer.
- Watch the stats-svc terminal. It logs
backfill izleyici: N dosya bulunduwhen it picks files up, andbackfill HATA …if one fails. - A
.rarthat won't open? Some HLTV archives trip the built-in unpacker; installingunarlets Freezetime recover them automatically. - A match stuck showing "parsing"? The system re-queues orphaned jobs on
its own within a few minutes; you can also re-run analysis manually with
(cd services/ml && uv run --no-editable ml-jobs). - Stats look stale after adding demos? They recompute automatically, but you
can force it any time with the same
ml-jobscommand above. No space left on devicein the logs? The demos/positions filled the disk (or, on macOS + Colima, the VM disk). Free space or grow the VM.
Manual alternatives to the watcher:
scripts/ingest-dir.shqueues a whole folder at once, and the in-browser My DB page processes private demos client-side.
The repo ships radar PNGs for the current competitive pool in
services/stats-svc/static/radars/, so the 2D replay looks like the in-game
radar out of the box. (They originate from the CS2 game files and are Valve's
property — included here purely so a non-commercial, free fan project works on
first clone. If Valve ever objects, they'll be removed; open an issue if you
represent the rights holder.)
Missing or new maps degrade gracefully: the replay falls back to a walkable-area silhouette derived from position data. To add a map yourself:
- one 1024×1024 PNG named exactly after the map (
de_train.png), dropped intoservices/stats-svc/static/radars/; - two-level maps (Nuke, Vertigo) also take
de_<map>_lower.pngfor the inset; - SVG works too and stays crisp at any zoom (
de_mirage.svgis tried before the PNG). Refresh the page, done — no restart needed.
The public archive site is not hosted on a server — it's a static snapshot of a self-hosted studio, published to GitHub for free. The pipeline:
services/stats-svc/cmd/exportwalks the running API and writes every page as a JSON file, plus one gzipped replay bundle per match (a few MB each).- Page JSONs and the web app are pushed to this repo's
gh-pagesbranch (served by GitHub Pages); match bundles go to Cloudflare R2 (pennies per month — GitHub Releases can't serve browserfetch()requests, their downloads carry no CORS headers). The site downloads a match's bundle on first view and caches it in the browser. scripts/publish.shdoes all of the above in one command, incrementally — already-published matches are never re-exported, and an interrupted run resumes where it left off.
Fork-friendly: set FREEZETIME_SITE_REPO=you/yourrepo (the URL base is derived
from the repo name automatically), put your R2 credentials in infra/.env
(R2_ENDPOINT, R2_ACCESS_KEY_ID, R2_SECRET_ACCESS_KEY, R2_BUCKET,
R2_PUBLIC_BASE — and add a CORS policy allowing your site's origin in the
R2 dashboard), run scripts/publish.sh, then enable Pages once
(Settings → Pages → deploy from branch gh-pages). Without R2 credentials
bundles fall back to GitHub Releases, which works for curl but not for
the in-browser replay.
- Plug in the archive SSD, open a terminal in the repo and run
scripts/weekly.sh(add--shutdownto power everything down at the end). It brings the platform up and waits for you.- Drop the week's demo archives (
.rar/.zipfrom HLTV) intobackfill/and press ENTER. Download first, then feed — never point the download manager straight atbackfill/; half-written files get picked up broken. Big batch? Let downloads finish before feeding (an external SSD throttles under simultaneous write load).- The script does the rest: waits for processing and the stats refresh, publishes only the new matches to GitHub, then prints a five-line health check (live-site match count, a real bundle download test, ML freshness, failed delta, disk usage). If a file is stuck ~10 min it warns you — that's usually a corrupt download: move it out of
backfill/, re-download, carry on.- Unplugging the SSD?
scripts/stop-all.shfirst, always (or use--shutdown).
- Everything lives on the SSD (
/Volumes/T7/cs2-freezetime/):cs2-platform/(this repo — open Claude Code HERE for help; it carries the full project memory),colima/(the VM: PostgreSQL + ClickHouse + MinIO with the raw-demo vault),backfill/(drop demos),downloads/(download staging),memory-backup/(assistant memory, auto-pushed to the privatefreezetime-claudememoryforbackuprepo on every commit).- On GitHub: code (
csfreezetime), the live site + page data + replay bundles (the code repo'sgh-pagesbranch; replay bundles live in Cloudflare R2), assistant memory (private).- If the SSD dies: nothing irreplaceable is lost — code, the published archive and the memory are on GitHub; raw demos re-download from HLTV.
- New machine / recovery: clone the code repo, clone the private memory repo and copy its
memory/into~/.claude/projects/<sanitized-repo-path>/memory/, then open Claude Code in the repo — it picks up exactly where things left off.
| Directory | Language | Role |
|---|---|---|
services/parser-worker |
Rust | demo.ingested → download → parse → ClickHouse ticks + PostgreSQL meta |
services/enrichment |
Python | trades, first-kills, buy classes, first-grenade flags |
services/stats-svc |
Go | the query engine, heatmap/replay/stacking API, and it serves the web app (:8090) |
services/ml |
Python | local statistics: strategy clustering, tendencies, roles, predictions, anomalies (uv run ml-jobs) |
apps/web |
React + TS | the UI: matches, 2D replay (PixiJS), and every analysis page |
infra/ |
— | docker-compose: PostgreSQL 16, ClickHouse, MinIO, NATS JetStream |
scripts/ |
— | schema apply, bulk ingest, end-to-end tests |
Why two databases: ClickHouse holds the heavy per-tick position data (millions of rows per match — great at "where was everyone at second 15 across 300 rounds"); PostgreSQL holds the relational meta and every pre-computed analysis table the coach reads. Services talk over NATS JetStream; raw demos live in MinIO (S3-compatible).
Every architectural decision is documented in docs/mimari.md (Turkish). New to the code? docs/how-it-works.md is the friendly tour and shows where to start reading.
This project was built end to end with, and is set up to be explored with,
Claude Code (Claude Fable 5). Clone it, open
Claude Code in the repo, and it reads CLAUDE.md (house rules) and
docs/mimari.md (architecture) — enough context to answer "where is the
win-probability table built?" or "add a filter to the opponent report." No
original author's notes required; everything a contributor needs is in the repo.
- Questions, setup help, ideas → start a Discussion.
- Found a bug or want a feature → open an Issue.
- Want to build on it → see CONTRIBUTING.md; forks and pull requests are welcome. It pairs nicely with Claude Code.
- Enjoying it? A ⭐ helps other people find it.
MIT — see LICENSE. Use it, fork it, ship it; just keep the copyright notice. No warranty.
Demo files are property of Valve / the tournament organizers and are not included in this repository; supply your own. The bundled CS2 radar images are Valve's property, included only so this free, non-commercial project works out of the box (see Map backgrounds).
- Add screenshots to the README (
docs/screenshots/).