A GNU R library for structural neuroimaging. Provides high-level functions to access (read and write) and visualize surface-based brain morphometry data (e.g. cortical thickness) for individual subjects and groups.
About | Installation | Documentation | Unit tests | License | Citation | Visualization examples | Contributing
The fsbrain R package provides a well-tested and consistent interface to neuroimaging data in R. It supports reading, writing, and visualizing various kinds of raw data and statistical results on brain surfaces and volumes. While the package provides a very convenient interface for working with data arranged in the standard FreeSurfer directory structure (SUBJECTS_DIR), fsbrain is not limited to this layout or FreeSurfer file formats. You can load brain meshes, volumes, and data from a range of other neuroimaging software packages and visualize them.
The plots produced by fsbrain can be integrated into R notebooks or written to high-quality image files, ready for publication. The rgl renderer used by fsbrain provides fast, hardware-accelerated rendering based on the OpenGL standard.
- 2020-09-20: The preprint of our paper T. Schaefer, C. Ecker: fsbrain: an R package for the visualization of structural neuroimaging data' is now available on biorxiv.
This software is for research puposes only and shall not be used for any clinical use.
You can find the fsbrain package on CRAN, so all you need to do is:
install.packages("fsbrain");In case something goes wrong, don't worry. Just install the missing system dependencies and retry.
This version is not guaranteed to be in a usable state, try at your own risk and run the tests before using it.
From an R session:
install.packages(c("devtools", "knitr", "markdown", "rmarkdown", "testthat", "qpdf"));
devtools::install_github("dfsp-spirit/fsbrain", build_vignettes=TRUE);A system dependency is a non-R software that is needed for the installation of a package. System dependencies cannot be installed automatically using the R package system, so you need to install them manually or using the package manager of your operating system.
The fsbrain package itself does not have any system dependencies, however, it uses rgl for rendering. You can check the SystemRequirements section on the rgl page at CRAN for the full list of rgl dependencies or read on. To get GIFTI format support, you will also need libxml2-dev.
To install the system dependencies for rgl and xml2:
R packages are compiled from source by default under Linux, so you need some development libraries. Before installing fsbrain, run the following command in your system shell (not in R):
- for deb-based Linux distributions (Debian, Ubuntu, ...):
sudo apt-get install libmagick++-dev libx11-dev libgl1-mesa-dev libglu1-mesa-dev mesa-common-dev libfreetype6-dev libxml2-dev libssh-dev libcurl4-openssl-dev- for rpm-based Linux distributions (Fedora, CentOS, RHEL, ...):
sudo yum install ImageMagick-c++-devel libX11-devel mesa-libGLU-devel freetype-devel libxml2-develIf you want to compile the package under any other operating system, you will need the libraries as well, of course.
Recent MacOS versions do not ship with an X11 environment. You will have to install the xquartz X11 system if you do not have it already. If you want to create GIF movies, make sure you have imagemagick installed (easiest via homebrew: brew install imagemagick@6).
The documentation can be accessed from within an R session after you have loaded the fsbrain package:
- There are two online R Markdown notebooks (like Jupyter Notebook in Python) that show various example plots in combination with the code used to produce them:
- basic fsbrain example notebook: plotting subject data
- advanced fsbrain example notebook: plotting group data
- A detailed vignette with explanations and examples for the functions of the package is included, run
browseVignettes("fsbrain")to see the vignettes. You can also open the vignette directly:- learn how to load and visualize surface-based neuroimaging data and results:
vignette("fsbrain")read online at CRAN - learn how to load and visualize volume-based neuroimaging data and results:
vignette("fsbrain_vol")read online at CRAN - read the fsbrain FAQ:
vignette("fsbrain_faq")read online at CRAN
- learn how to load and visualize surface-based neuroimaging data and results:
- Help for a specific function can be accessed in the usual R manner:
?<function>, where you replace<function>with a function name. Like this:?group.morph.native. - Run
example(<function>)to see a live demo that uses the function<function>. Like this:example(group.morph.native). - The unit tests that come with this package are essentially a list of examples that illustrate how to use the functions.
This package comes with lots of unit tests. To run them, in a clean R session:
library(devtools)
library(fsbrain)
devtools::check()
Continuous integration results:

AppVeyor CI under Windows
The displayed status represents the development version. Don't worry if you are using the stable version from CRAN and CI is currently failing, development happens on master.
The fsbrain package is free software, published under the MIT license.
Note: The file LICENSE in this repository is a CRAN license template only (as required by CRAN) and does not contain the full MIT license text. See the file LICENSE_FULL for the full license text.
If you use fsbrain, please cite our paper:
- The preprint is available on biorxiv: T. Schaefer, C. Ecker: fsbrain: an R package for the visualization of structural neuroimaging data. direct link to PDF at biorxiv
Other materials related to fsbrain:
- A poster of fsbrain has been presented at INSAR 2020 Annual Meeting: Abstract, ePoster viewer, PDF download
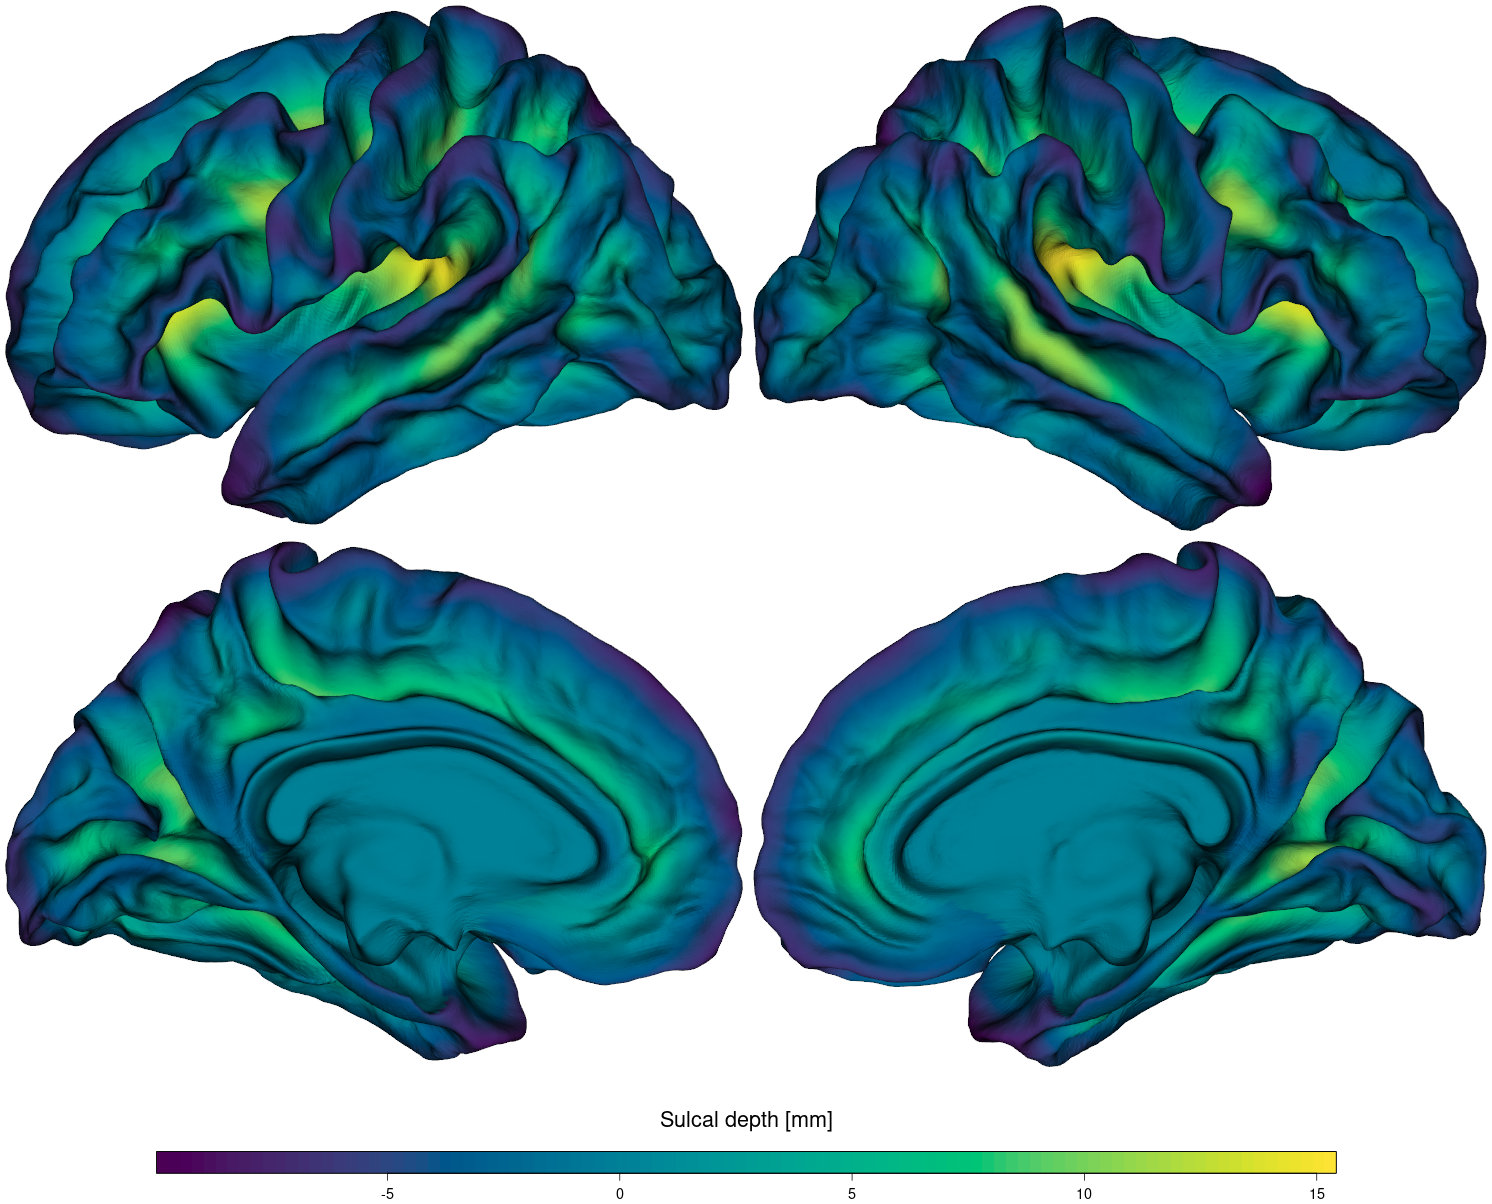
The fsbrain package support visualizations of different data, and all data can be displayed in one or more views. The figure below shows some examples for surface-based data:

- Subfigure A shows the visualization of raw morphometry data (cortical thickness) from native space on the white surface of a subject. The view shows the data in tiles from 8 different angles.
- Subfigure B illustrates arbitrary data (p-values in this case) visualized on the regions of the Desikan atlas, using the surface of the fsaverage (standard space template) subject from FreeSurfer. The view shows the data in tiles from 4 different angles.
- Subfigure C displays the regions of the Desikan atlas on the white surface of a subject. The colors were loaded from the respective annotation file. The view shows the data in tiles from 4 different angles.
What is displayed (morphometry data, atlas regions, arbitrary other data), on which surface it is displayed, and how it is displayed (a single interactive view, 4 tiles, 9 tiles) is independent and can be selected as needed in fsbrain.
Here is a second figure, showing the same data (the mean curvature at each vertex) displayed on 3 different surfaces of a subject: A white surface, B pial surface, C inflated surface.

The next figure illustrates some options to visualize your results with different backgrounds. A Clusters on the white fsaverage surface with sulc background. B Region-wise p-values with curv background, inflated fsaverage surface. C A background color layer displaying outlines of aparc atlas regions in the respective colors, inflated demo subject surface.

Want to see brains spin? Check this out. (WARNING: loads 8 MB webpage with animated gif).
First versions of some volume visualization functions are available in the current dev version. You can find a preview of the results here.
To see a combination of example figures and the code used to produce them, you should have a look at the example notebooks: getting started notebook and advanced examples notebook.
Please refer to CONTRIBUTING.md.
If you have any question, suggestion or comment on fsbrain, please open an issue. If you want to contact me via email, please use the maintainer email address listed on the CRAN webpage for fsbrain.