The following analysis was done for eductional purposes and uses Venmo transactions gathered of the course of a month in November 2020.
In 2019, $99 billion dollars, were sent using mobile payment platforms like Apple Pay, Android Pay, PayPal, and Venmo. Typically these transactions are safeguarded, unable to be viewed by those not involved in the transaction, but this is not the case for Venmo. Venmo is a digital wallet platform that enables electronic peer-to-peer payments, making it easy to request gas money from a friend or pay a landlord for rent. However, what makes Venmo unique is that it is both a mobile payment platform and a social media platform. Venmo allows users to connect their account with either an email or an existing Facebook profile, making it easy for users to find and add friends from other social media platforms. Users can send transactions to people in their friends list or to any other user on the platform. When making a transaction users must include a message along with the amount of money to be sent or charged. Users have the option of making their transactions private, visible to their friends, or visible to everyone with a Venmo account. Other users can then see the message included in these transactions in their news feed along with who is sending and receiving the transactions, in effect these transactions look like posts to other users. This is not unique to Venmo, most social media platforms allow users to share their posts with the world. However what is unique to Venmo is that each post represents a financial transaction, and by analyzing the content of these posts one can determine real-world trends in consumer behavior and demand for products and services. Here we use the messages in these posts to analyze long term and season trends in consumer behavior and how it has been affected by the pandemic. We will specifically focus on the use of emojis, as including emojis in Venmo posts is very common, 64% percent of posts contain emojis, and interpreting the meaning of most emojis is fairly straightforward.
In order to obtain the Venmo transactions used in this analysis one can use the following url venmo.com/username, where username is the unique username for each user. Given a valid username you are given an html file including the most recent 5 public transaction; from each transaction we can get the time sent, the usernames of the people involved in the transaction, and the message accompanying the transaction. This seems to be the only way at the moment of viewing public Venmo transactions without signing in to Venmo. If one wants to request a multitude of user transaction the hardest step will be finding valid usernames. In this analyis the folllowing method is used.
- Get the most recent Venmo transactions from any user and record the usernames of the users involved in the transactions(at best we will get 5 at worst 1). Add these usernames to a list of unchecked usernames, and add the original user to a list of checked usernames.
- Get the most recent Venmo transactions from someone in the unchecked users, if there are any new unchecked usernames add these to the uncheck username list, and then add the searched username to the checked username list.
- Repeat step 2 until one runs out of usernames to check.
There are two problems that arise in this method, we tend to get almost no older transactions as we are only being shown the most recent transactions coupled with the fact that users who are involved in a recent transaction tend to be frequently using Venmo and so their 5 recent transactions will all be very new. Another problem is we quickly run out of new users to seach, as many users either Venmo very few people or groups of friends tend to only Venmo other friends which creates cycles, this can be thought of as a cycle in graph theory.
To reduce these cycling and recency problems. We observe that most Venmo usernames have a common theme, as most users go with the default username. Which is of the form: first_name-last_name-number Example: John-Doe-10
This number tends to be an increment based on how many people with the same first name and last name signed up before any user. Therefore if this number is low we can assume that be searching with same first name and last name with smaller number increments we can obtain valid usernames. This turns out to help solve both the cycling and recency problems, although getting a sizable sample of very old transactions is still hard.
When analyzing the frequency of emojis used in a given time period we will use the following method.

Here we divide by the number of posts containing any emoji and not the total number of posts because the use of emojis is not consistent with the number of posts as emojis have become more popular in recent years. Additionally, we will only count the use of a specific emoji once per post, as posts can potentially contain thousands of the same emoji.
You can find the number of emojis sent per second in Emoji-per-second, which contains the average number of emojis sent per second over an hour. You can find the total number of emojis sent per second in Total-Emojis. From this one can calculate the emoji frequency.
Some of the results will be displayed here.
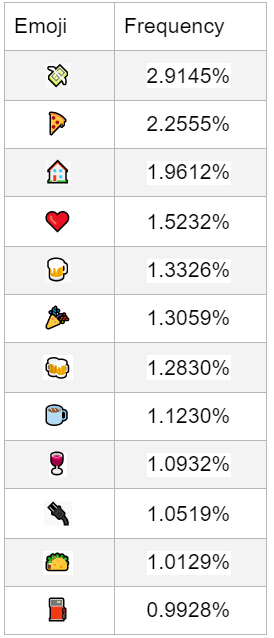
Most Used Emojis
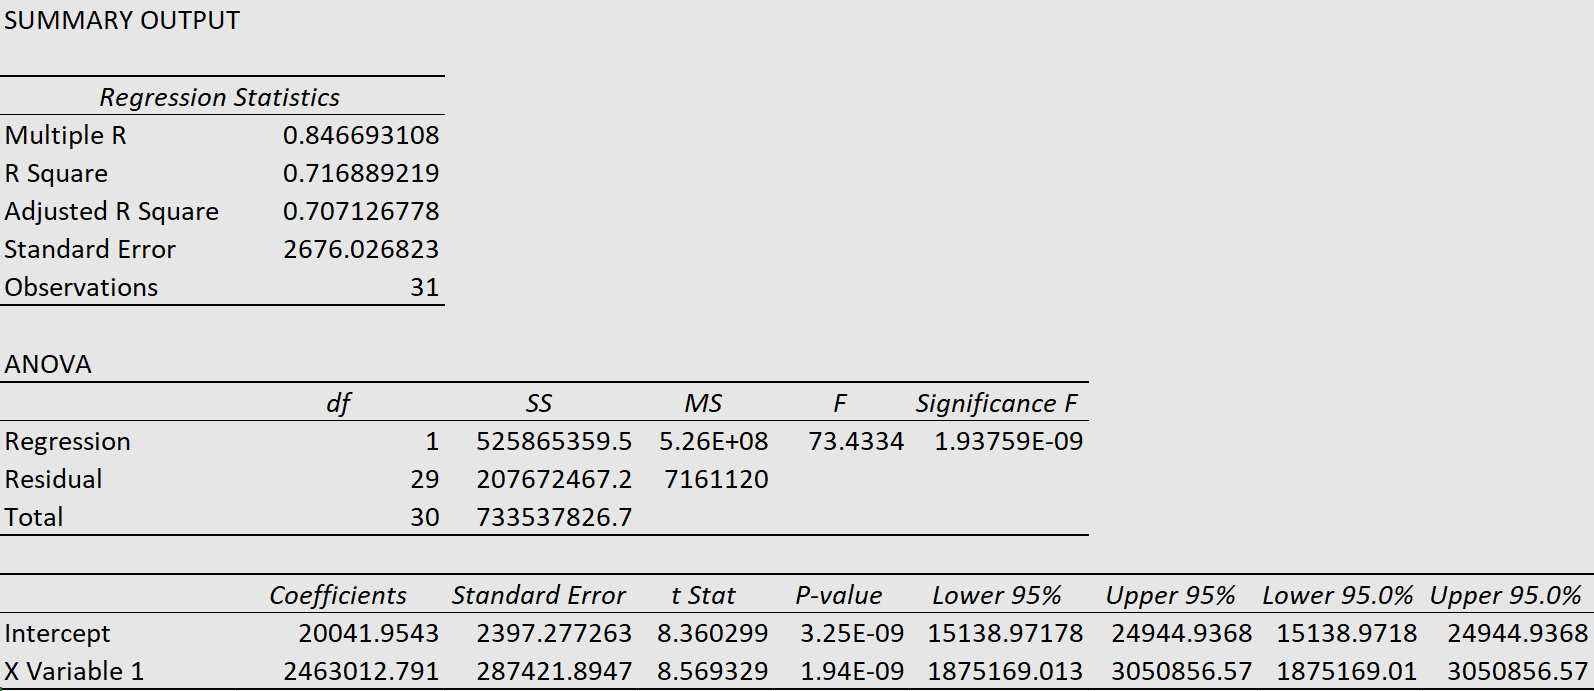
Predicting Gasoline Sales
Here we used fuel pump emoji ⛽ to predict gasoline sales

where predicted_sales_in_millions = 2,463,013 x emoji_frequency + 20042
source: https://www.statista.com/statistics/1026897/us-retail-gasoline-station-sales-on-a-monthly-basis/
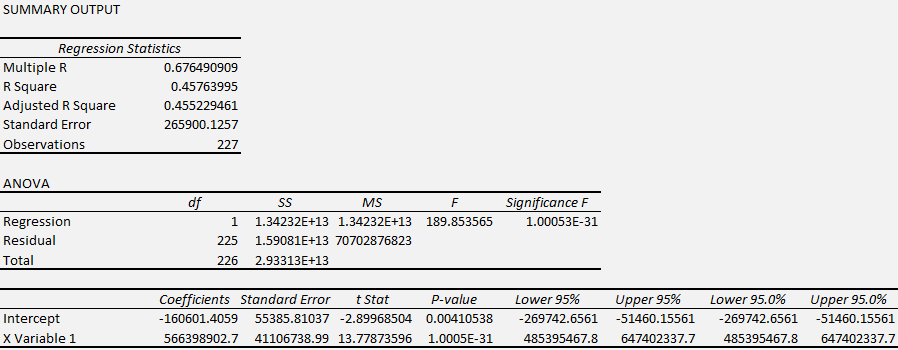
Predicting Airline Passengers
Here we used the aggregate of the following emojis

where predicted_travelers = 566,398,903 x emoji_frequency - 1,606,061
source: https://www.tsa.gov/coronavirus/passenger-throughput