
A complete end-to-end IoT solution for real-time stress detection. This system utilizes a hybrid Deep Learning model (CNN+GRU) deployed on a Wear OS smartwatch to analyze sensor data, syncs results via Firebase, and visualizes live stress events on a React web dashboard.
Academic Project • Machine Learning: Supervised Tehniques • Faculty of Electrical Engineering (ETF) Sarajevo



- Overview
- System Architecture
- Demos & Live Dashboards
- Machine Learning Pipeline
- Prototypes
- Repository Structure
- Installation & Usage
- Results
- Contributors
Stress is a prevalent health issue affecting productivity and well-being. While many wearables track heart rate, few offer real-time, medical-grade stress classification.
This project implements a Multimodal Stress Monitoring System that:
- Analyzes physiological data (HRV, EDA, BVP, Temp) using Deep Learning.
- Performs Inference directly on the wearable device (Edge AI).
- Streams data to the cloud for remote monitoring.
The system was developed through rigorous phases: from EDA and baseline LSTM models to a refined Hybrid CNN + GRU architecture optimized for mobile deployment.
The wearable dashboard is currently deployed and listening for live events from wearable devices. View Live Dashboard
The survey-based webapp is currently deployed and ready for use. Visit Web App
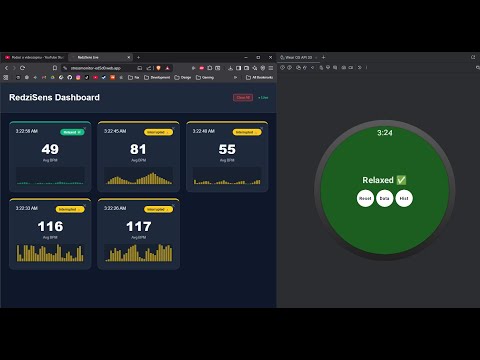
1st: A showcase of the Wearable app performing inference and the React Dashboard updating in real-time.
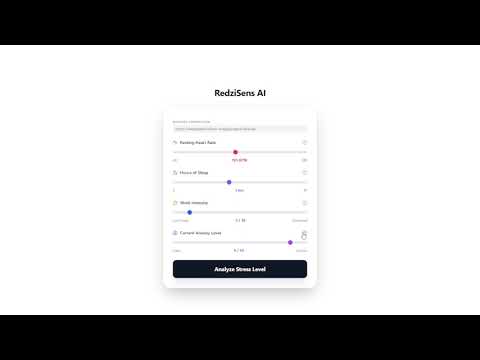
2st: A showcase of the Survey-based webapp performing inference in real-time.
The solution consists of three main components connected via the cloud:
- Wearable Device (Android): Simulates sensor data collection and runs the
.pt(PyTorch Lite) model for on-device inference. - Backend (Firebase): Acts as the real-time bridge, storing sensor readings and stress labels with timestamp validation.
- Frontend (React Dashboard): A live interface for visualizing stress trends, heart rate variability, and historical logs.

We experimented with 9 different architectures before finalizing the edge model.

- Input: 30-second windows of physiological signals (BVP, EDA, Temp).
- Preprocessing: Normalization, Sliding Window Segmentation.
- Feature Selection: Reduced input size to 5 critical features (
MEAN_RR,SDRR,RMSSD,HR,pNN50) to ensure high performance on limited smartwatch hardware.
- Baseline: LSTM (Long Short-Term Memory).
- Intermediate: Bi-LSTM (inspired by xLSTM) and ResNet.
- Top Performers: CNN (Convolutional Neural Networks) and GRU (Gated Recurrent Units).
For the wearable application, we combined the strengths of both top models:
- CNN Layers: Extract spatial features (patterns in physiological spikes) from sensor signals.
- GRU Layers: Capture temporal dependencies over the 30-step window. It is faster and more "mobile-friendly" than a standard LSTM.
- Performance: The hybrid model showed realistic generalization (avoiding pure CNN overfitting) and was exported as
stress_model.ptfor Android.

Built in Android Studio. It reads sensor data (simulated for testing stability), processes it through the PyTorch model, and displays:
- Real-time BPM.
- Stress Label (Relaxed, Stressed, Interrupted).
- Uploads data to Firebase (optimized with debounce to prevent API spam).
A Dark-mode UI hosted on Firebase.
- Live Connection: Listens to Firebase Realtime Database.
- Visuals: Dynamic cards with Sparkline charts for heart rate.
- Alerts: Visual feedback for "Stressed" (Red) or "Interrupted" (Yellow) states.
├── Code
│   ├── Comparison              # Jupyter notebooks comparing model performance
│   ├── EDA                     # Exploratory Data Analysis notebooks
│   ├── SurveyAPI               # Server starter for survey-based webapp
│   ├── Traning                 # Training scripts for baseline and improved models
│   └── Traning-waearable       # Final Hybrid model training & .pt android export
├── Dataset
│   ├── full.csv                # Complete processed dataset
│   ├── train.csv               # Splited training dataset
│   ├── test.csv                # Splited testing dataset
│   ├── train-wearable.csv      # Optimized 5-feature train dataset
│   └── test-wearable.csv       # Optimized 5-feature test dataset
├── Documentation               # PDF Reports and Demo Video
├── Models
│   ├── base                    # 9 trained models
│   └── wearable                # stress_model.pt for Android
├── Presentations               # Midterm and Final slides
├── Prototypes
│   ├── StressMonitorDashbord   # Web Dashbord (React.js) Source
│   └── StressMonitorWearable   # Wearable App (Kotlin) Source
└── README.md
cd Code
# Make sure to have a virtual environment with required packages
jupyter notebook- Open Android Studio.
- Select Open and navigate to
Prototypes/StressMonitorWearable. - Read the README inside for additional setup.
- Sync Gradle files.
- Start an Emulator (Wear OS Square/Round) or connect a physical Galaxy Watch.
- Run the app (Green Play Button).
cd Prototypes/StressMonitorDashbord
npm install
npm start- Comparison: The CNN model initially showed the highest accuracy on the static dataset.
- Generalization: The Hybrid CNN+GRU proved most robust for stream data, balancing precision with computational efficiency.
- Latency: The full pipeline (Watch -> Cloud -> Web) achieves sub-second latency for live updates.
The Hybrid CNN+GRU model achieved a 97% accuracy on the final test set, demonstrating robust classification across all stress categories without significant overfitting.

| Class | Precision | Recall | F1-Score | Support |
|---|---|---|---|---|
| no stress | 0.99 | 0.96 | 0.98 | 22142 |
| interruption | 0.96 | 0.98 | 0.97 | 11772 |
| time pressure | 0.95 | 0.99 | 0.97 | 7089 |
| accuracy | 0.97 | 41003 | ||
| macro avg | 0.97 | 0.98 | 0.97 | 41003 |
| weighted avg | 0.97 | 0.97 | 0.97 | 41003 |
- Emin Hadžiabdić [@ehadziabdic]
- Armin Memišević [@arminn2206]
- Muhammed Pašić [@MuhaxD]
This project is licensed under the MIT License - see the LICENSE file for details.