

Graphsignal is an inference observability platform that helps developers accelerate and troubleshoot AI systems. It provides essential visibility across the inference stack, including:
- Continuous, high-resolution profiling timelines exposing operation durations and resource utilization across inference workloads.
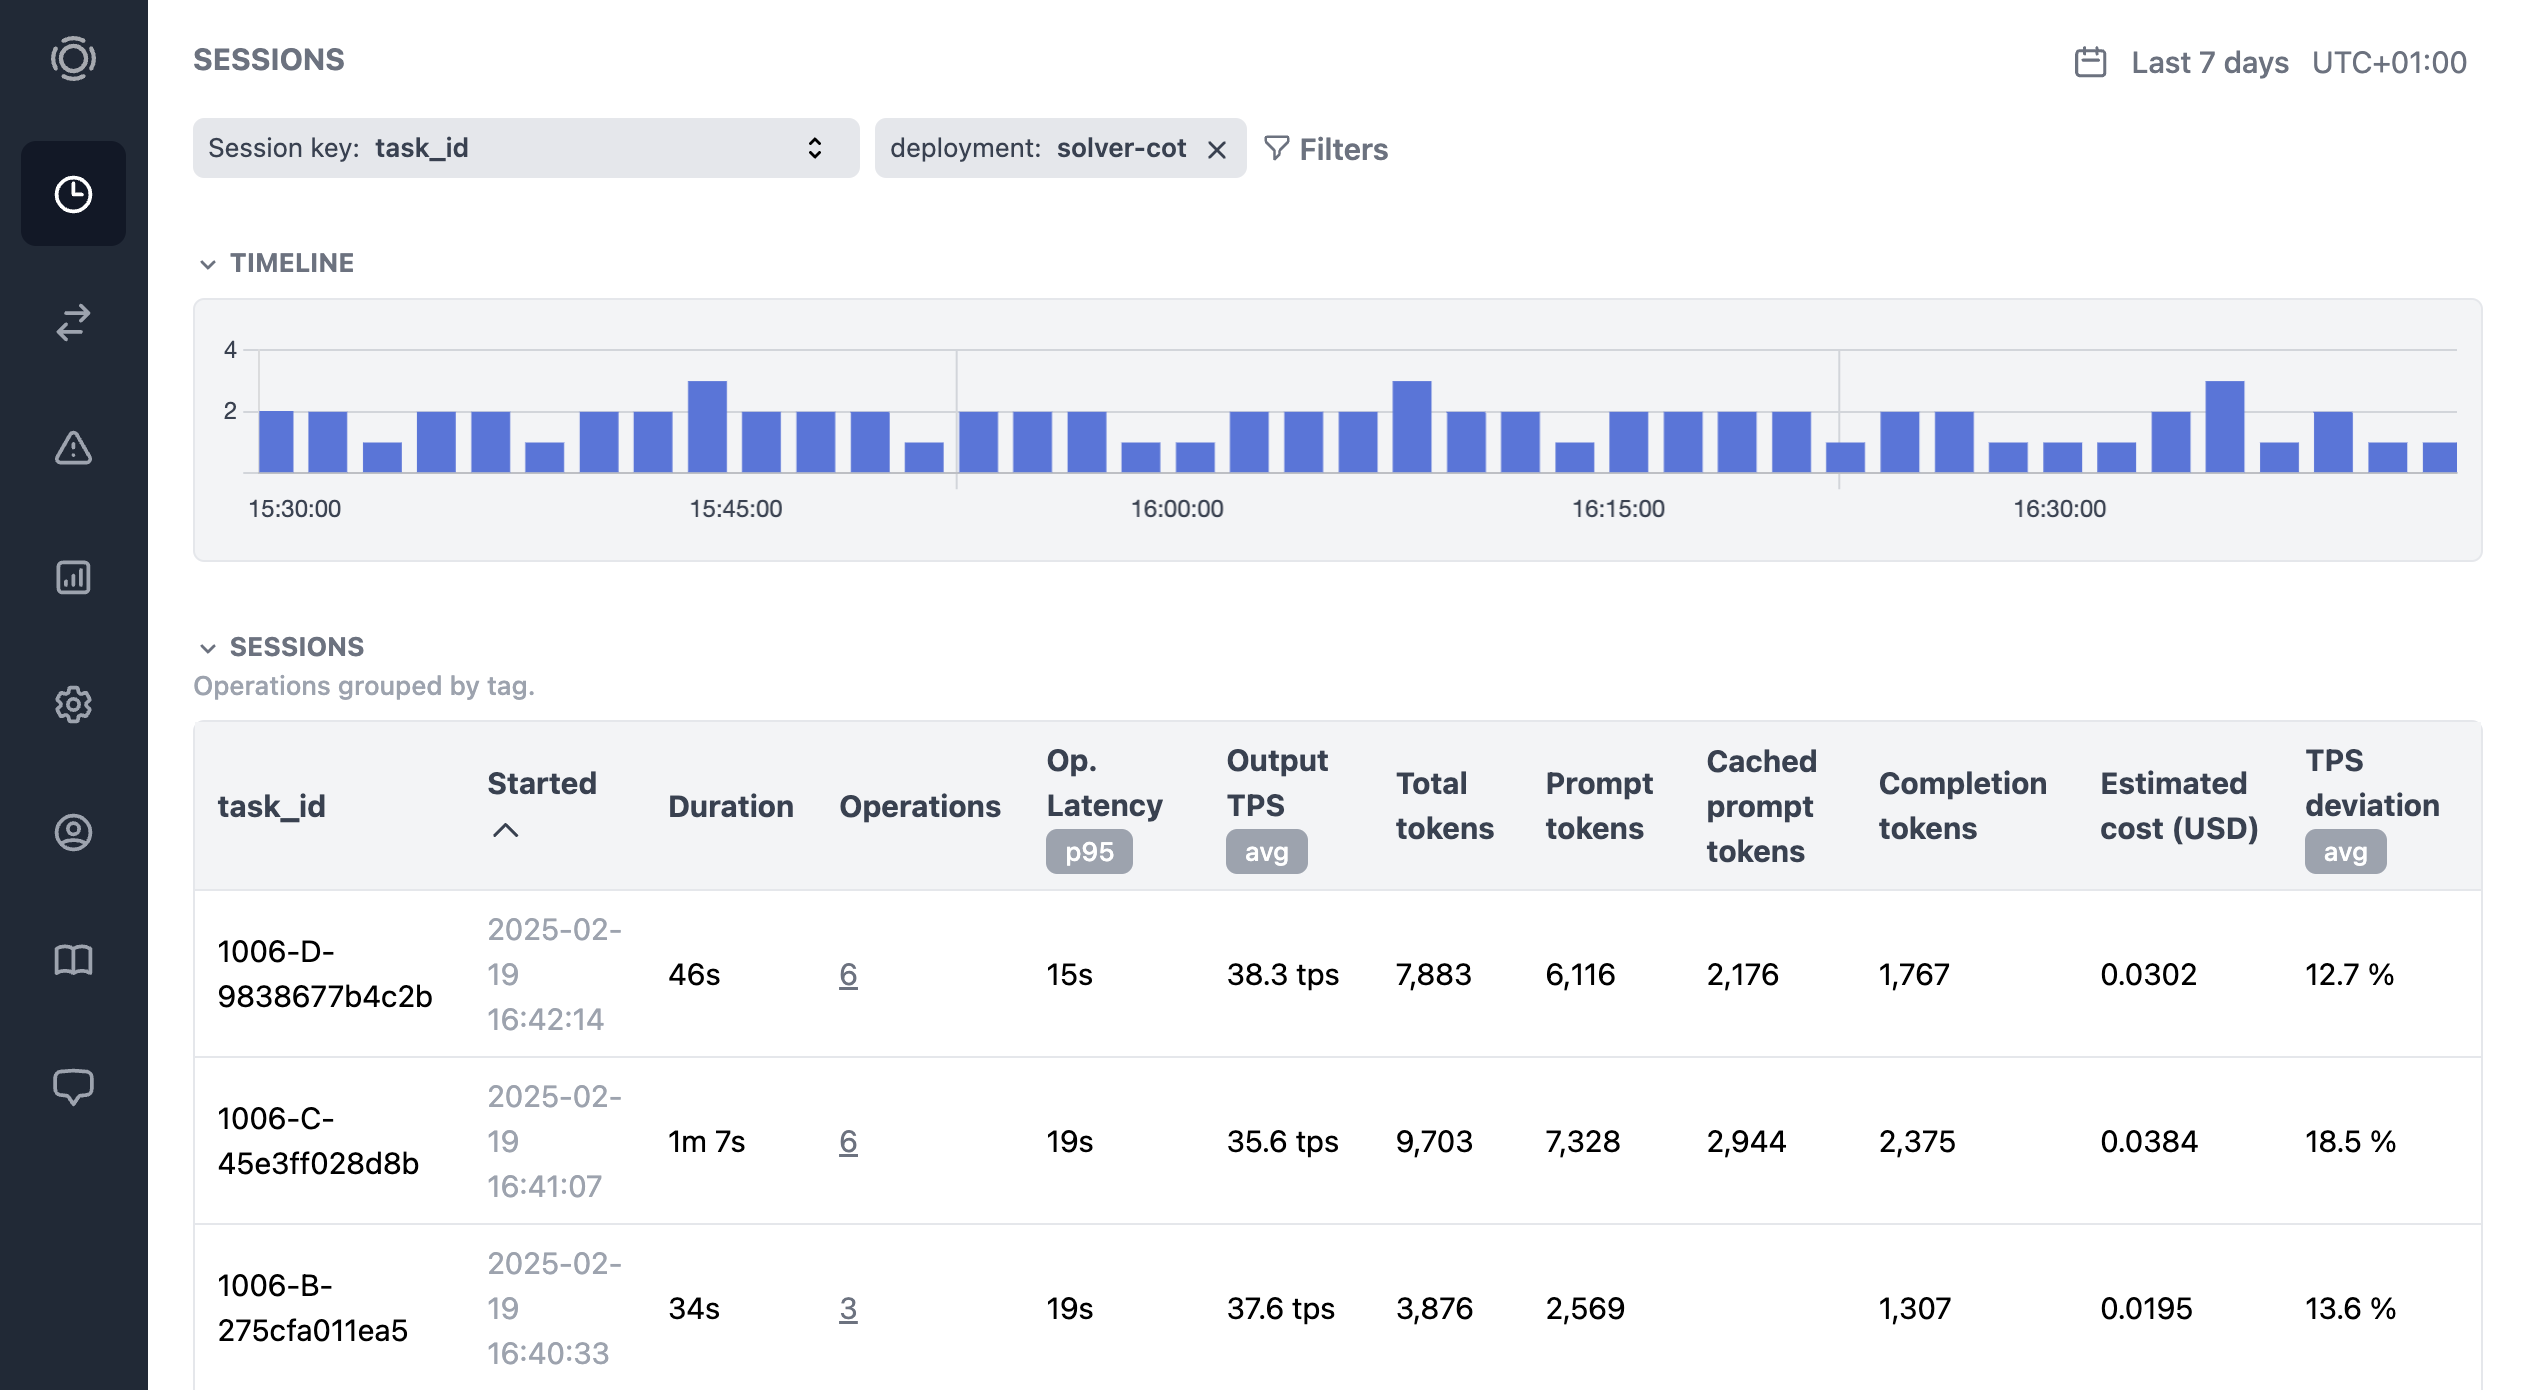
- LLM generation tracing with per-step timing, token throughput, and latency breakdowns for major inference frameworks.
- System-level metrics for inference engines and hardware (CPU, GPU, accelerators).
- Error monitoring for device-level failures, runtime exceptions, and inference errors.
Learn more at graphsignal.com.
Install the Graphsignal library.
pip install -U graphsignalGPU profiling (Linux): For CUPTI-based GPU profiling, install the extra matching your CUDA version: pip install graphsignal[cu12] (CUDA 12.x) or pip install graphsignal[cu13] (CUDA 13.x).
Configure the Graphsignal SDK by specifying your API key directly or via the GRAPHSIGNAL_API_KEY environment variable.
import graphsignal

graphsignal.configure(api_key='my-api-key')
# or pass the API key in GRAPHSIGNAL_API_KEY environment variable
See configure() API docs for all configuration parameters.
To get an API key, sign up for a free account at graphsignal.com. The key can then be found in your account's Settings / API Keys page.
Alternatively, you can use the Graphsignal runner when running your application. Pass the API key via the GRAPHSIGNAL_API_KEY environment variable.
graphsignal-run <my-app>Graphsignal integrates through tracing - either via auto-instrumentation or manual setup. It automatically captures traces, errors, performance profiles, and data. All insights are available for analysis at app.graphsignal.com.
Refer to the guides below for detailed information on:
See integration documentation for libraries and inference engines:
See the API reference for complete documentation.
Log in to Graphsignal to monitor and analyze your application.
Graphsignal tracer is highly lightweight. The overhead per trace is measured to be less than 100 microseconds. While profiling can introduce slight overhead, the profiling rate is limited.
The Graphsignal tracer only establishes outbound connections to api.graphsignal.com to send data; inbound connections or commands are not possible.
Content and sensitive information, such as prompts and completions, are not recorded.
To enable debug logging, add debug_mode=True to configure(). If the debug log doesn’t provide hints for resolving the issue, report it to our support team via your account.
In case of connection issues, please make sure outgoing connections to https://api.graphsignal.com are allowed.