A complete CI/CD pipeline implementation with real-time monitoring dashboard that demonstrates modern DevOps practices and pipeline automation.



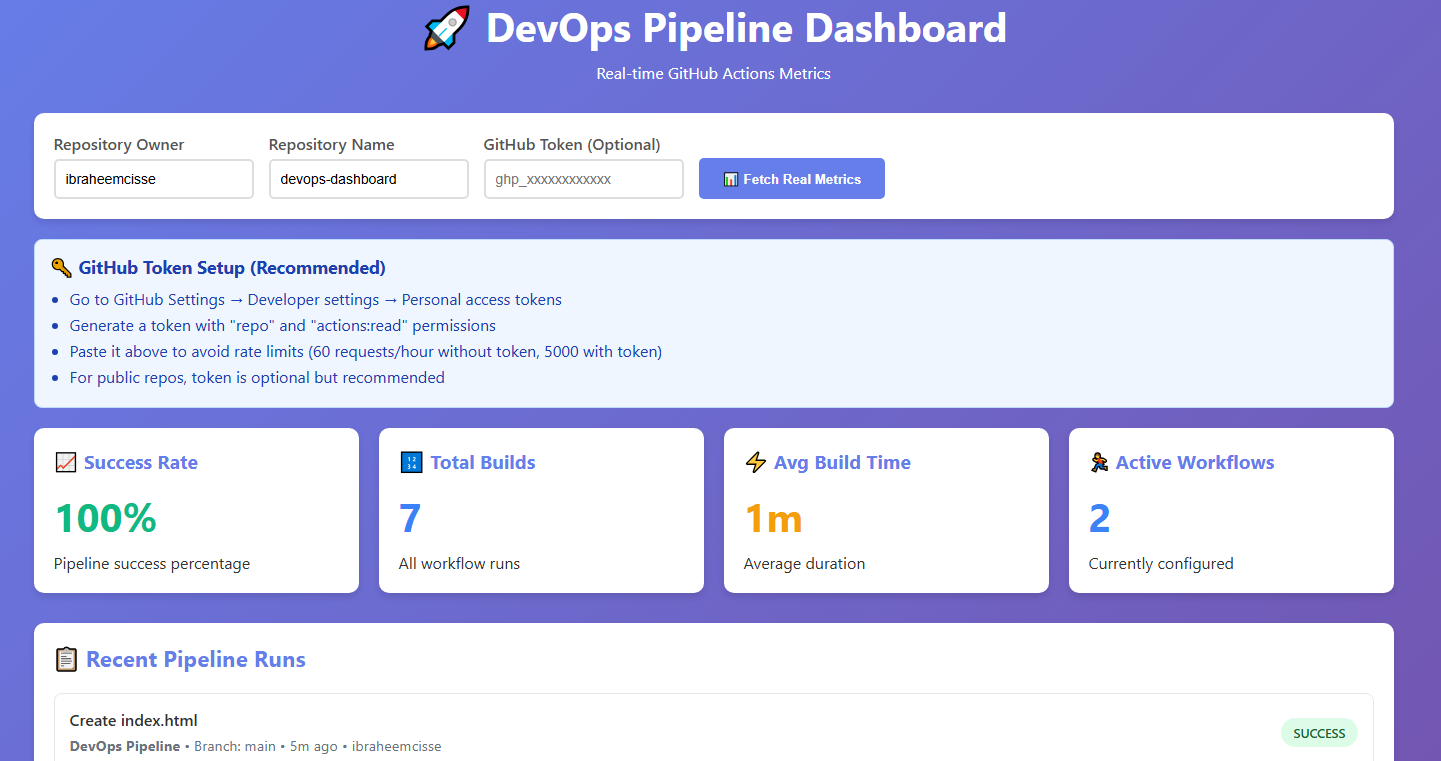
This project showcases a production-ready CI/CD pipeline with an interactive monitoring dashboard that displays real metrics from GitHub Actions. Unlike typical demo projects with static data, this dashboard fetches live pipeline statistics and build information directly from the GitHub API.
The dashboard transforms static demo data into live pipeline monitoring through three key steps:
📡 Real-Time API Integration - Fetches actual data from GitHub Actions API instead of fake metrics 🧮 Live Calculations - Computes real success rates, build times, and status from your pipeline runs 📊 Dynamic Updates - Auto-refreshes every 5 minutes with current pipeline performance
javascript// Real API calls instead of mock data const metrics = await fetch('https://api.github.com/repos/owner/repo/actions/runs'); Result: When your pipeline fails, the dashboard shows actual failures. When you deploy successfully, it displays real performance metrics - creating a genuine DevOps monitoring tool.
- Automated Testing - Runs comprehensive test suite on every commit
- Docker Integration - Containerized builds with multi-stage optimization
- Health Checks - Automated container verification and smoke tests
- Conditional Deployment - Smart deployment logic based on branch and test results
- Build Artifacts - Proper image tagging with SHA and latest tags
- Live Metrics - Actual success rates, build times, and pipeline statistics
- Recent Builds - Real-time view of latest pipeline runs with status
- GitHub API Integration - Direct connection to repository data
- Auto-refresh - Updates every 5 minutes automatically
- Responsive Design - Works seamlessly on desktop and mobile
- Infrastructure as Code - All configuration in version control
- Automated Quality Gates - No manual intervention required
- Containerization - Docker-first approach for consistency
- Branch Protection - Different workflows for development vs production
- Monitoring & Observability - Complete visibility into pipeline performance
graph TD
    A[Code Push] --> B[GitHub Actions]
    B --> C[Run Tests]
    C --> D[Build Docker Image]
    D --> E[Integration Tests]
    E --> F[Deploy to Production]
    F --> G[Update Dashboard]

    H[GitHub API] --> I[Live Dashboard]
    I --> J[Real Metrics Display]

    style A fill:#f9f,stroke:#333,stroke-width:2px
    style F fill:#9f9,stroke:#333,stroke-width:2px
    style I fill:#bbf,stroke:#333,stroke-width:2px
- Docker installed
- Git installed
- GitHub account
- Modern web browser
git clone https://github.com/ibraheemcisse/devops-dashboard.git
cd devops-dashboard# Build and run dashboard
cd my-app
docker build -t devops-dashboard .
docker run -p 8080:80 devops-dashboard
# Access at http://localhost:8080# Start all services
docker-compose up -d
# View logs
docker-compose logs -f# Run tests
./scripts/run-tests.sh
# Build application
./scripts/build.sh
# Deploy (production)
./scripts/deploy.shdevops-dashboard/
├── .github/workflows/ # CI/CD Pipeline Configuration
│ └── ci.yml # GitHub Actions workflow
├── my-app/ # Application Source Code
│ ├── Dockerfile # Container configuration
│ ├── nginx.conf # Web server config
│ └── src/ # Application files
├── scripts/ # Automation Scripts
│ ├── build.sh # Build automation
│ ├── deploy.sh # Deployment script
│ └── run-tests.sh # Test execution
├── docs/ # Documentation
├── index.html # Live Dashboard (GitHub Pages)
├── docker-compose.yml # Local development setup
└── README.md # This file
The pipeline automatically:
- Triggers on pushes to
main/developand pull requests - Tests the application with comprehensive test suite
- Builds Docker images with proper tagging
- Verifies container health with integration tests
- Deploys to production (main branch only)
- Updates the live dashboard with new metrics
- Multi-stage builds for optimized container size
- Parallel execution where possible for speed
- Failure isolation - pinpoint exactly where issues occur
- Artifact management - proper image versioning and storage
- Security scanning - automated vulnerability checks
- Success Rate - Real percentage from your pipeline runs
- Total Builds - Actual count of workflow executions
- Average Build Time - Calculated from real run durations
- Active Workflows - Number of configured pipelines
- Build Status - Success/Failed/In Progress from GitHub Actions
- Commit Information - Messages, authors, and timestamps
- Branch Details - Which branch triggered the build
- Direct Links - Quick access to GitHub Actions logs
// Real GitHub API calls instead of mock data
const response = await fetch('https://api.github.com/repos/owner/repo/actions/runs');
const realMetrics = await response.json();- Secrets Management - Sensitive data stored in GitHub Secrets
- Least Privilege - Minimal required permissions for actions
- Container Security - Non-root user, minimal base images
- Input Validation - Sanitized inputs and outputs
- Rate Limiting - Proper GitHub API usage with tokens
- Version Control - Everything tracked in Git
- Automated Testing - No manual testing required
- Immutable Deployments - Each build creates new artifacts
- Monitoring - Complete visibility into system health
- Documentation - Comprehensive setup and usage guides
The dashboard is automatically deployed to GitHub Pages at: https://ibraheemcisse.github.io/devops-dashboard/
- Code pushed to
mainbranch - Pipeline builds and tests application
- Tests pass → Deploy to GitHub Pages
- Dashboard updates with latest metrics
- Live site reflects changes within minutes
- Pipeline Success/Failure Rates
- Build Duration Trends
- Deployment Frequency
- Test Coverage Results
- Container Health Status
- Dashboard refreshes every 5 minutes
- GitHub API provides latest pipeline data
- No manual intervention required
- Historical data preserved
# Unit Tests
npm test

# Integration Tests
docker-compose -f docker-compose.test.yml up --abort-on-container-exit

# End-to-End Tests
./scripts/run-e2e-tests.sh

# Security Tests
docker run --rm -v $(pwd):/app security-scanner- Code Coverage - Minimum 80% required
- Security Scan - No high-severity vulnerabilities
- Performance - Build time under 5 minutes
- Integration - All services respond correctly
- GitHub Actions - Pipeline automation
- Docker - Containerization
- Nginx - Web server
- GitHub Pages - Hosting platform
- Vanilla JavaScript - No framework dependencies
- GitHub API - Real-time data source
- CSS3 & HTML5 - Modern responsive design
- REST APIs - Data fetching and integration
- Docker Compose - Local development
- Bash Scripts - Automation utilities
- Git - Version control
- YAML - Configuration management
- Fork the repository
- Create a feature branch (
git checkout -b feature/amazing-feature) - Commit your changes (
git commit -m 'Add amazing feature') - Push to branch (
git push origin feature/amazing-feature) - Open a Pull Request
- Write tests for new features
- Follow existing code style
- Update documentation as needed
- Ensure CI/CD pipeline passes
- Multi-repository support - Monitor multiple projects
- Slack/Teams notifications - Real-time alerts
- Performance analytics - Detailed build metrics
- Custom dashboards - Team-specific views
- API endpoints - External integrations
- Deployment rollback - One-click revert capability
- A/B testing - Automated feature flag management
- Cost tracking - Resource usage monitoring
- Compliance reporting - Audit trail generation
This project is licensed under the MIT License - see the LICENSE file for details.
- GitHub Actions - Excellent CI/CD platform
- Docker - Containerization made simple
- GitHub Pages - Free and reliable hosting
- Open Source Community - Inspiration and best practices
- Author: Ibraheem Cisse
- Project Link: https://github.com/ibraheemcisse/devops-dashboard
- Live Dashboard: https://ibraheemcisse.github.io/devops-dashboard/
⭐ Give this project a star if it helped you learn DevOps practices!
Built with ❤️ to demonstrate modern CI/CD pipeline implementation and real-time monitoring capabilities.