Application that utilizes Dash and several sources to vizualise coronavirus data.
-
- Global Stats
- Global Bar Chart
- Country datatable
All the NovelCOVID/API related code is at service/data_service.py
-
- Confirmed cases, deaths and recoveries timeline
All the WHO data files related code is at service/who_service.py
The service/service.py simply acts as a dispatcher for the other two services.
Three types of graphs are used from the dash components:

Very simple chart that is provided a list of values and list of headers. Headers are used as x axis labels and values as y axis values. Updated constantly via NovelCOVID/API.
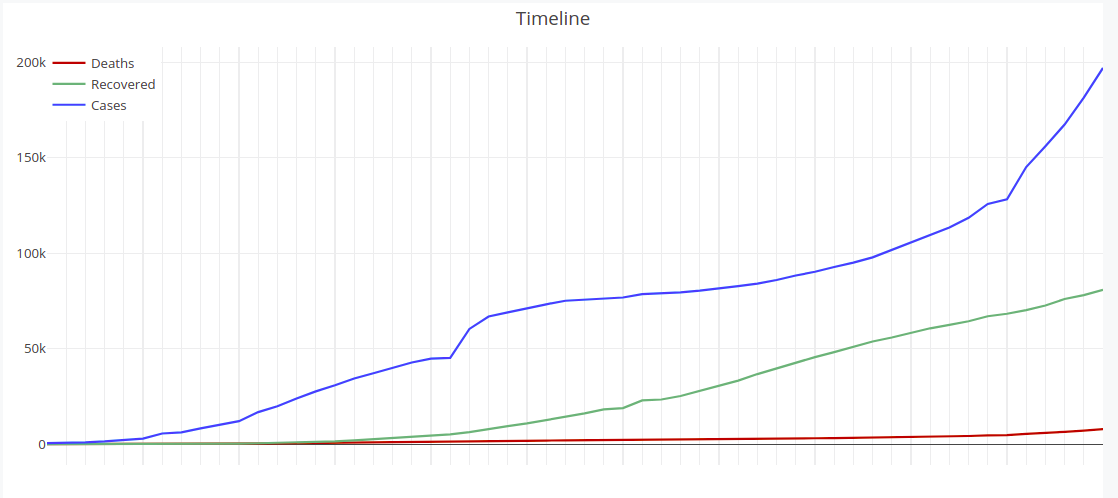 Multiline chart that is used as timeline. Data is updated daily from the file provided from WHO.
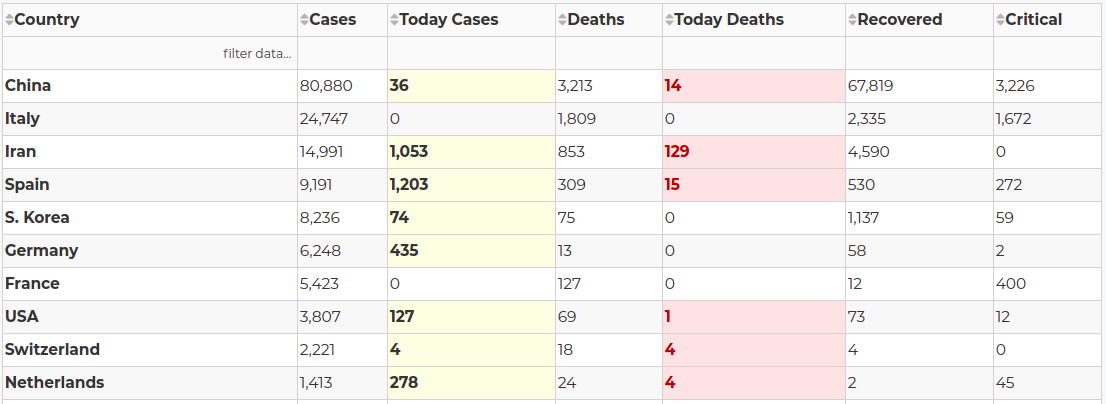 Datatable that include full country data and also highlights new cases and deaths. Filtering and sorting are enabled as provided natively from Dash. Updated constantly via NovelCOVID/API.
- Procfile: File used to deploy in Heroku
- .gitignore: Boilerplate gitignore file for Python projects
- assets/theme.css: Dash provides some styling from codepen (can be found in app.py as external stylesheet). In order to have the application's theme modified a custom theme has been created. Majority of the styling is in here and is related to the Div and Graph dash components.
Create a new folder for the project and initialize git and virual environment and activate the latter:
$ mkdir dash-covid
$ cd dash-covid
$ git clone https://github.com/karolosk/dash_example.git
$ cd dash_example
$ virtualenv venv
$ source venv/bin/activate
Install the needed dependecies in your virual environment:
$ pip install -r requirements.txtFinally run the application:
$ python app.py # or python3 app.py if you have both versionsApplication will start at port 8050
Standard Heroku deployment, pulling from master on eah commit.
Application can be found here: Dash-Covid