(1) Project Overview
##Visualizing Mosquito Abundance Readily available historical climate data and models of future climate scenarios provide rich resources for scientists to model climate-dependent factors in the environment, such as the abundance of mosquitos. A model of mosquito abundance uses historical and modeled climate data to predict mosquito populations. This project uses various climate datasets (historical, RCP 4.5 and RCP 8.5) to run the mosquito abundance model over urban land areas. These values are then projected on a map to illustrate the changes in mosquito abundance as a function of climate changes over time. The result is an animation of mosquito abundance for every day from the beginning of 1950 through the end of 2099.
##Workflow
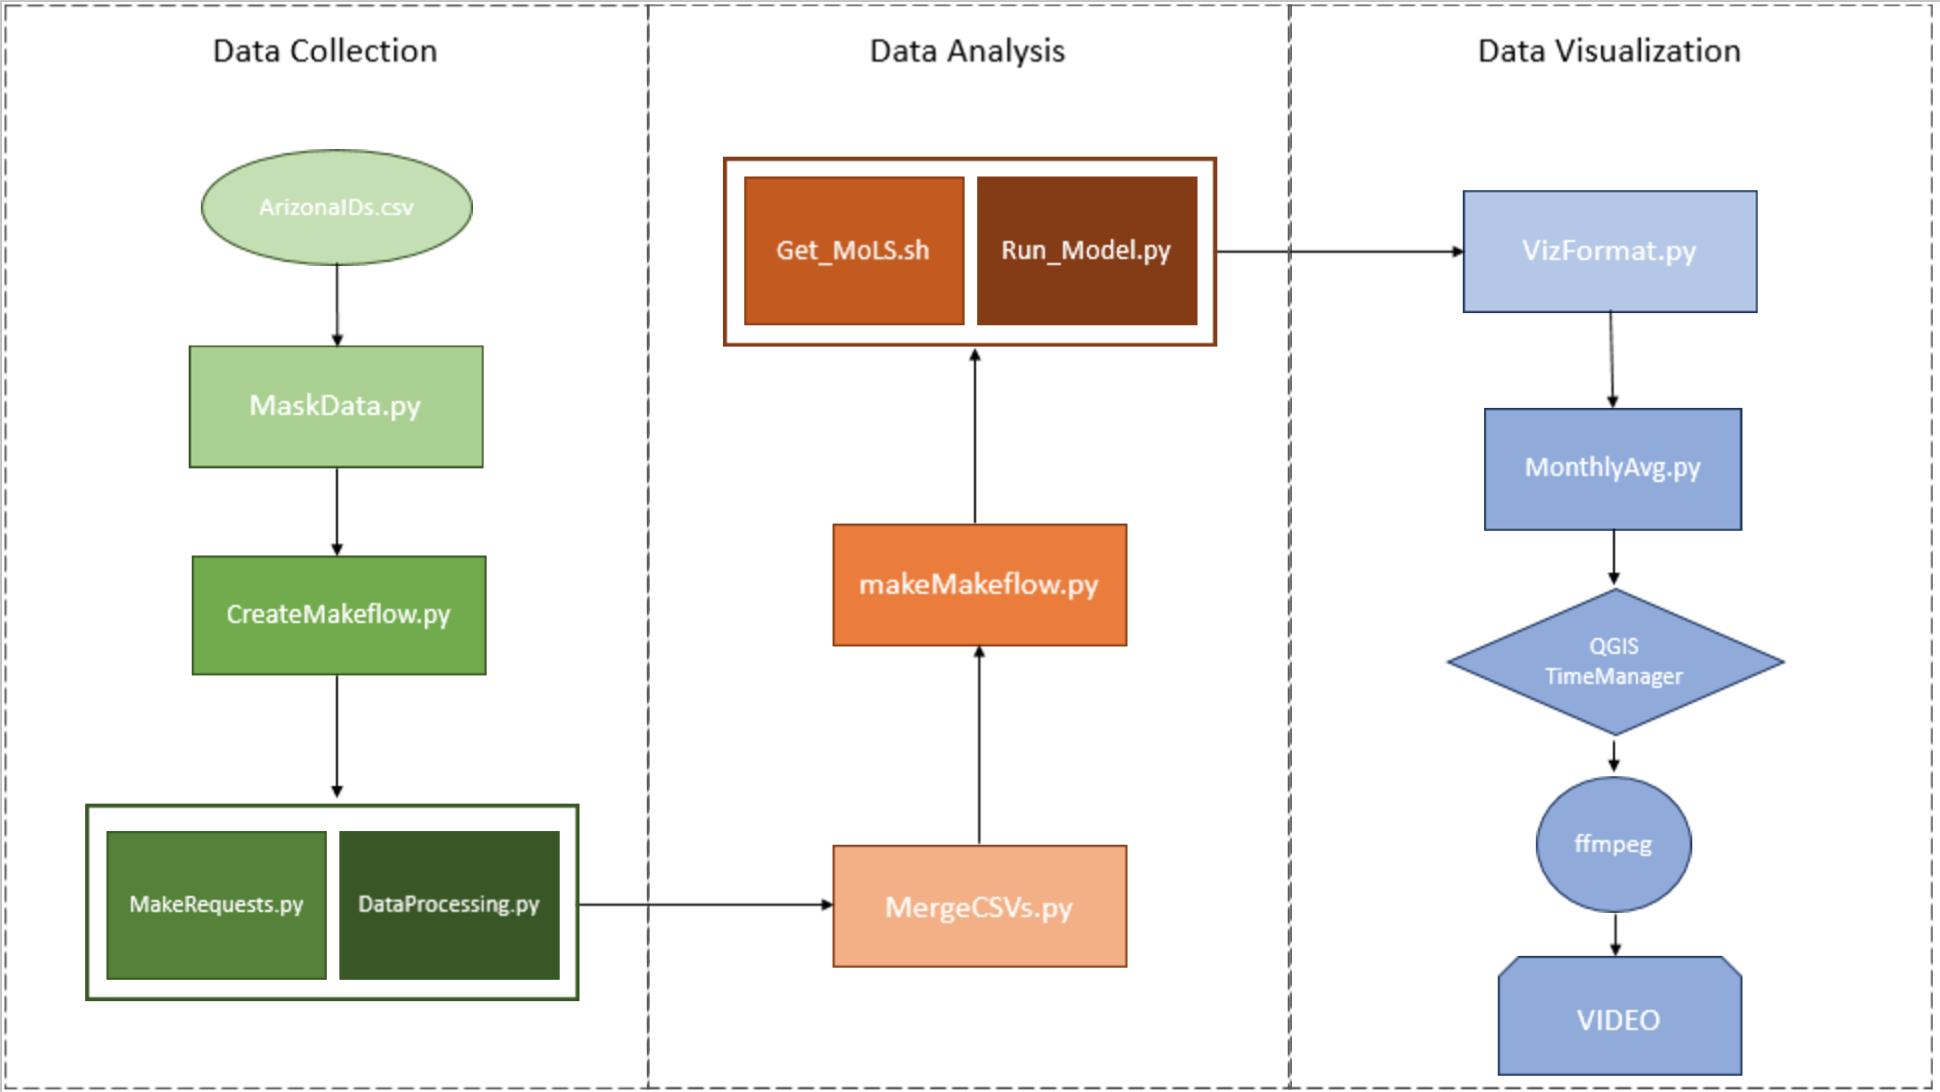
##Data Location Unprocessed and Processed Data:
TeamArizona(Trenta Master) Chameleon instance, IP: 129.114.32.112
##Results Here is the video visualizing mosquito abundance across Arizona (RCP 4.5) https://www.youtube.com/watch?v=OK-EvmFFvtY&feature=youtu.be
RCP 4.5 and 8.5 FL, and RCP 8.5 AZ data expected to finish running through the model on 12/13/2016 evening
##Contents of GitHub Repo DataCollection: List of latitude/longitude coordinates for every state, scripts to curl climate data, mask data to include only developed areas, reformat data to csv for MoLS
ScaleUp: Includes scripts to run model via makeflow and workqueue
Visualization: Includes monthly averaging and scripts to format csv files for QGIS. This directory also includes shapefiles for each state's boundaries