Reliability Project is a Master's Degree Project to extract, treat and load data from an air compressor in a database and show it up in a dynamic dashboard for near-real-time follow up.
In the below image it is possible to visualize the laboratory setup from SENAI located in Ribeirão Preto, Brazil.
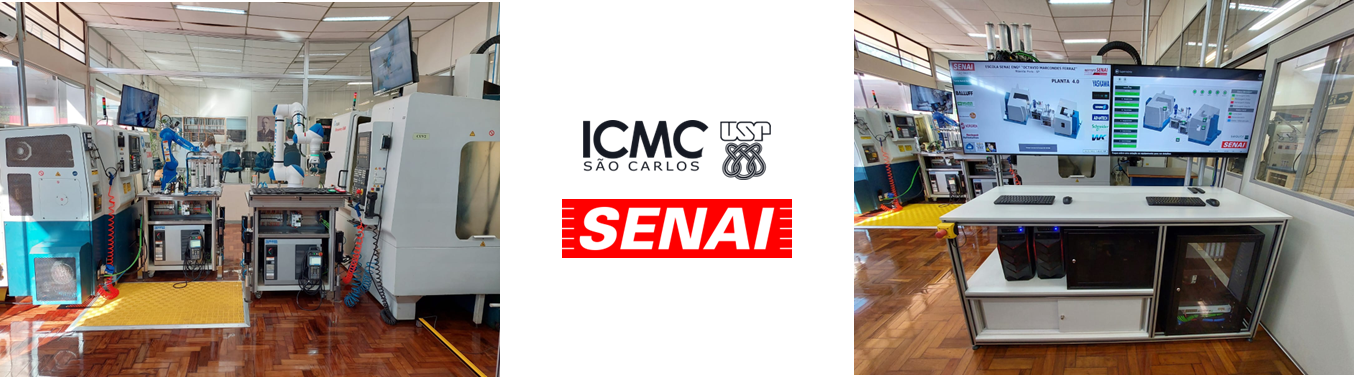
The setup has multiple robotic systems used for process automation. Such kind of industrial robots are fed by an air compressor, enabling the robots to perform a multiple series of movements through pneumatic force.
- Required for Industrial Automation
- Good Air = dry, free of particles
But, as all machines, to have the air compressor working continuously, it is required maintenance.
There are three main types of system maintenance:
- Corretive: No maintenance is done, until the machine fails, then machine is fixed
- Preventive: Maintenance is done periodically to prevent the machine to fail
- Predictive: Data is collected to detect possible damage and warn about the need for a fix
Main advantage of predictive maintenance is that it uses data to define the optimum time to perform maintenance. This way, resources are saved by not replacing/fixing the system before needed, and also by replacing/fix before the system fails.
- Advanced Technology
- Internet of Things
- Monitoring
- 5G
- Artificial Intelligence
Due to multiple catalyzers, the system monitoring to detect and predict failures is evolving faster than ever. By combining IoT sensors, data is collected and loaded to databases, that are analysed through Python algorithms to find patterns and propose actions (Machine Learning).
The above concepts were applied to the laboratory setup available in SENAI Ribeirão Preto.
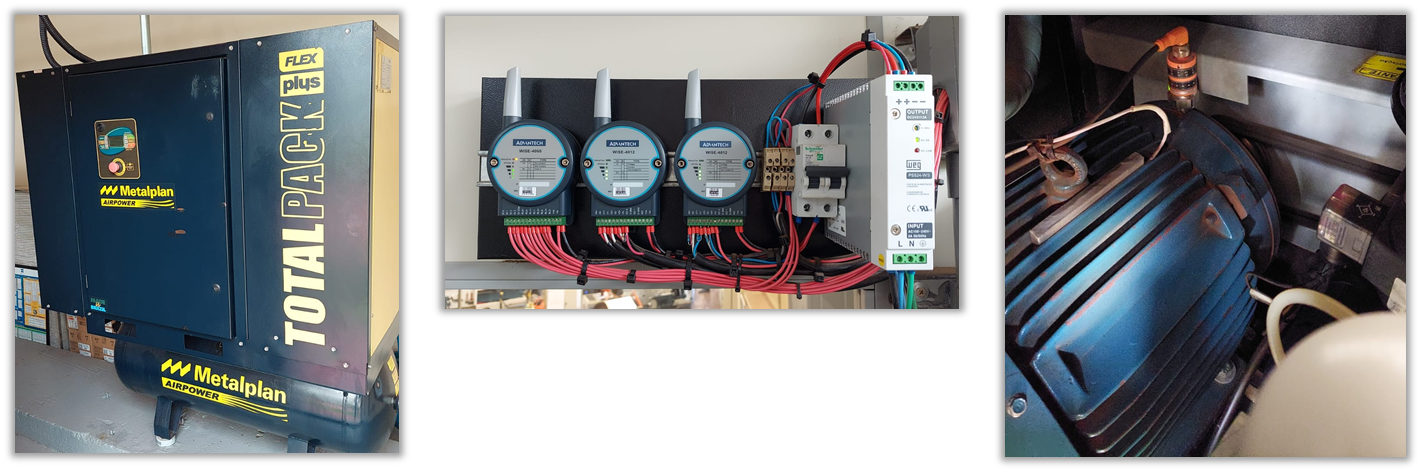
As per the picture below, a set of 3 IoT sensors were installed to monitor 9 key parameters from an air compressor that is used to fed multiple automation industry robots.
- [IoT1]: Motor Frequency in Hz
- [IoT1]: Motor Power in W
- [IoT1]: Vibration in mm/s²
- [IoT2]: Air Pressure in bar
- [IoT2]: Air Temperature in ºC
- [IoT2]: Oil Temperature in ºC
- [IoT2]: Motor Temperature in ºC
- [IoT3]: System Status (ON/OFF)
- [IoT3]: CLP Status (Operational/Failure)
Data is being continuosly collected, but the analysis from this project has used data from 2022-09-06 22:24:43 to 2022-10-03 21:43:43
A first analysis with the data available was done to find the parameters which major impact over the system.
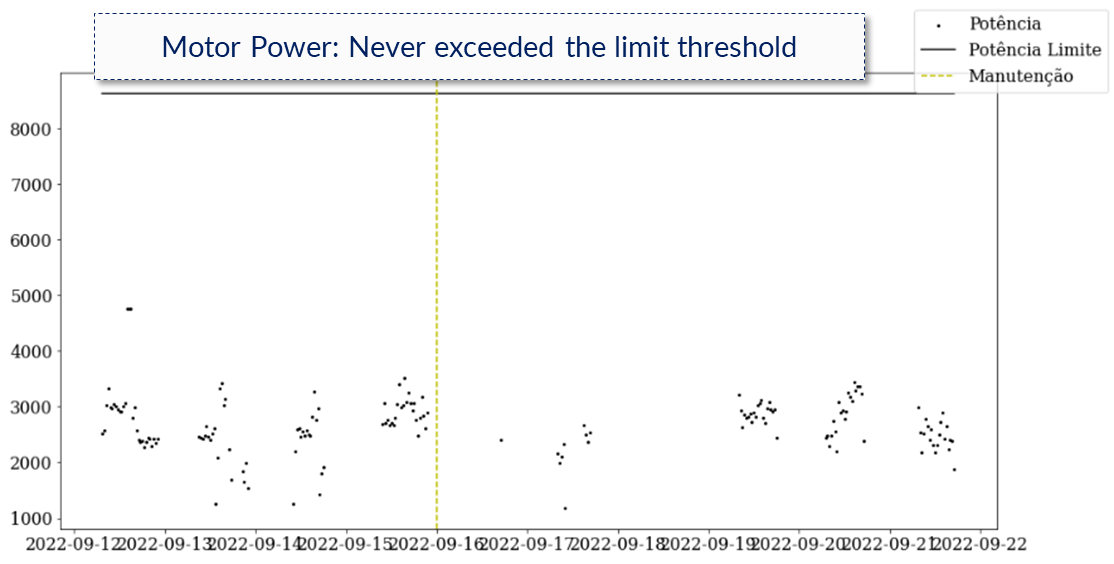
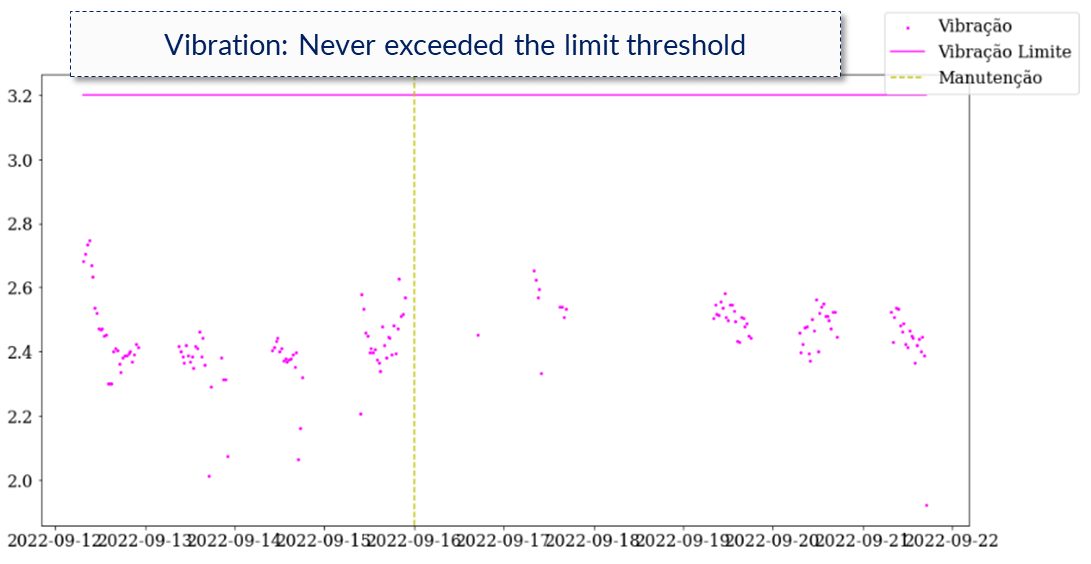
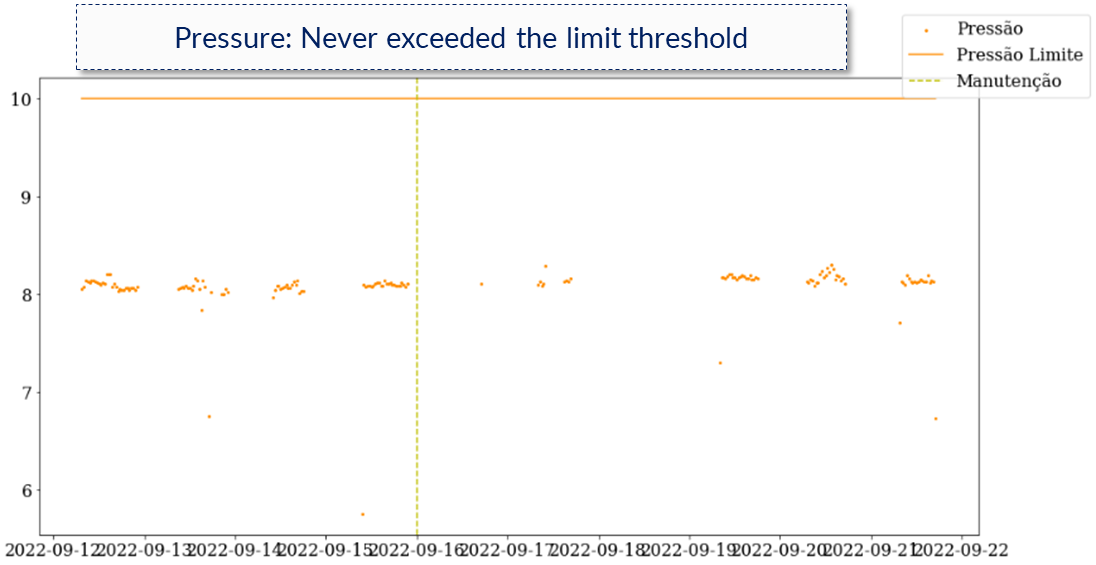
From above analysis, Vibration, Pressure and Motor Power were classified as not key parameters for further analysis.
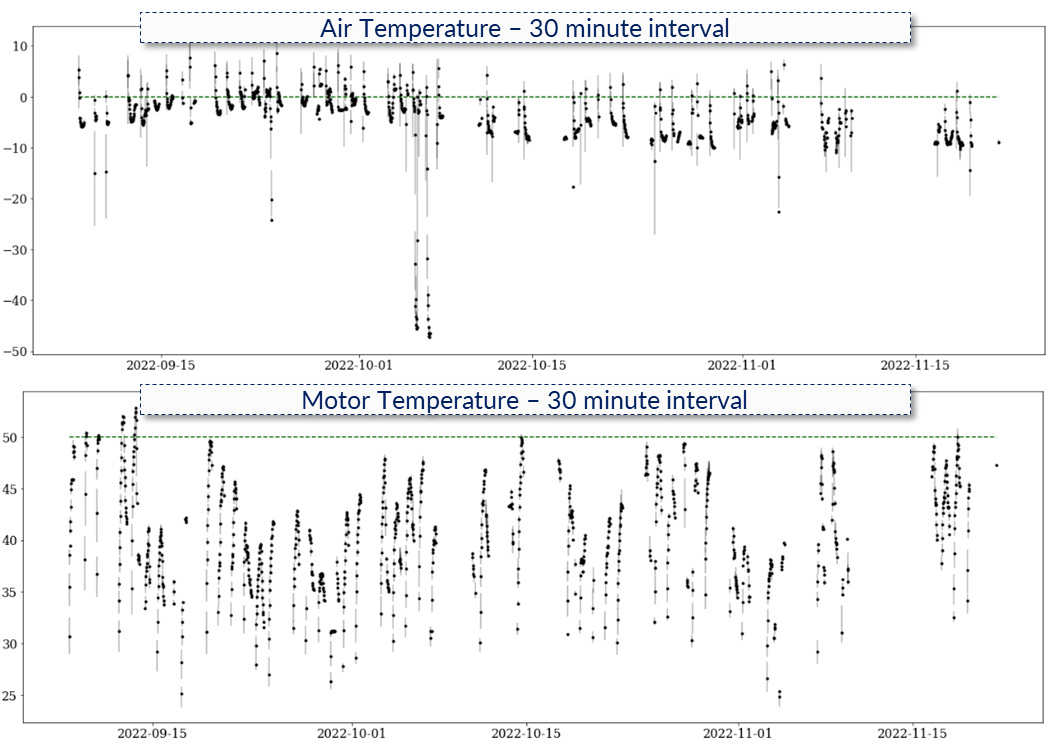
Air Temperature, Oil Temperature and Motor Temperature, are considered the 3 major parameters for further analysis, as can be seem in the next picture, those are the parameters which exceeded the limit thresholds defined more often.
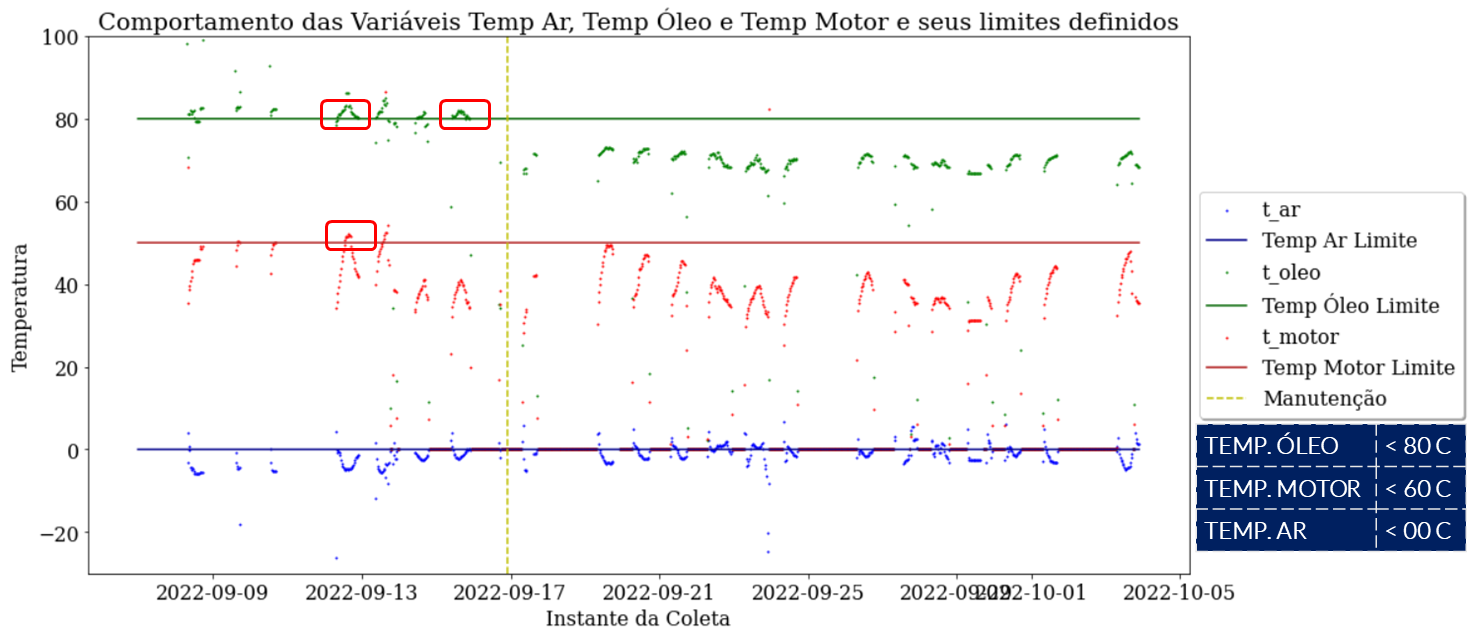
It is also possible to mensure how many times and for how long each of the parameters exceeded the set threshold.
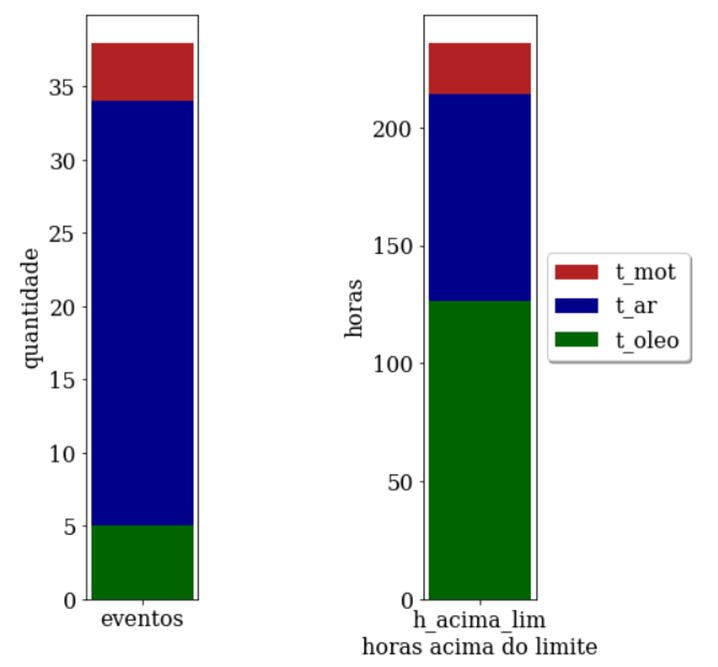
As per the above picture, Oil Temperature, only exceeded the limit 5 times, but it sums up to 125 hours. Meanwhile, Air Temperature, exceeded the limit much more often, with 28 times, yet its total was about 87 hours.
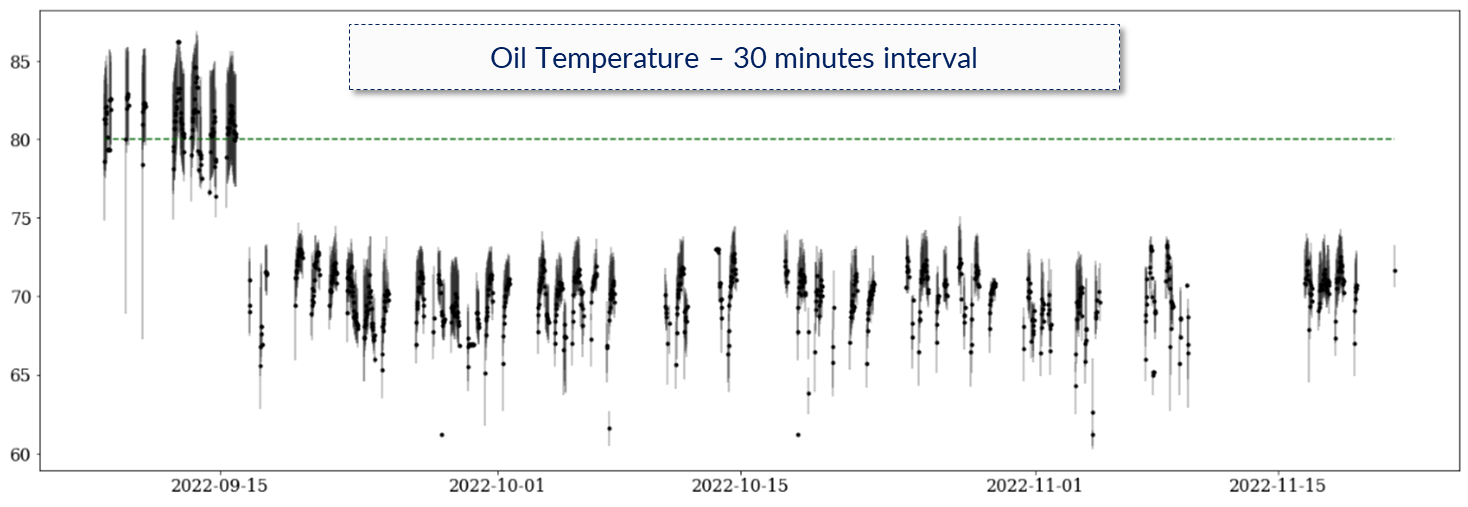
A detailed analysis shows that Oil Temperature, besides having more time above the limit, was being impacted by a failure (maintenance required), and after the maintenance action (replacing the old oil to a new one), it was possible to its value controlled. This is clearly shown by the imagem below.
The same view is shown below for Air Temperature and Oil Temperature:
The goal is to predict failures in a way to perform the maintenance and prevent them.
The algorithm selected for predicting is based in the number of failures and time per failure. Then, Air Temperature, Oil Temperature and Motor Temperature are transformed to the structure requested by the algorithm, which is ploted below:
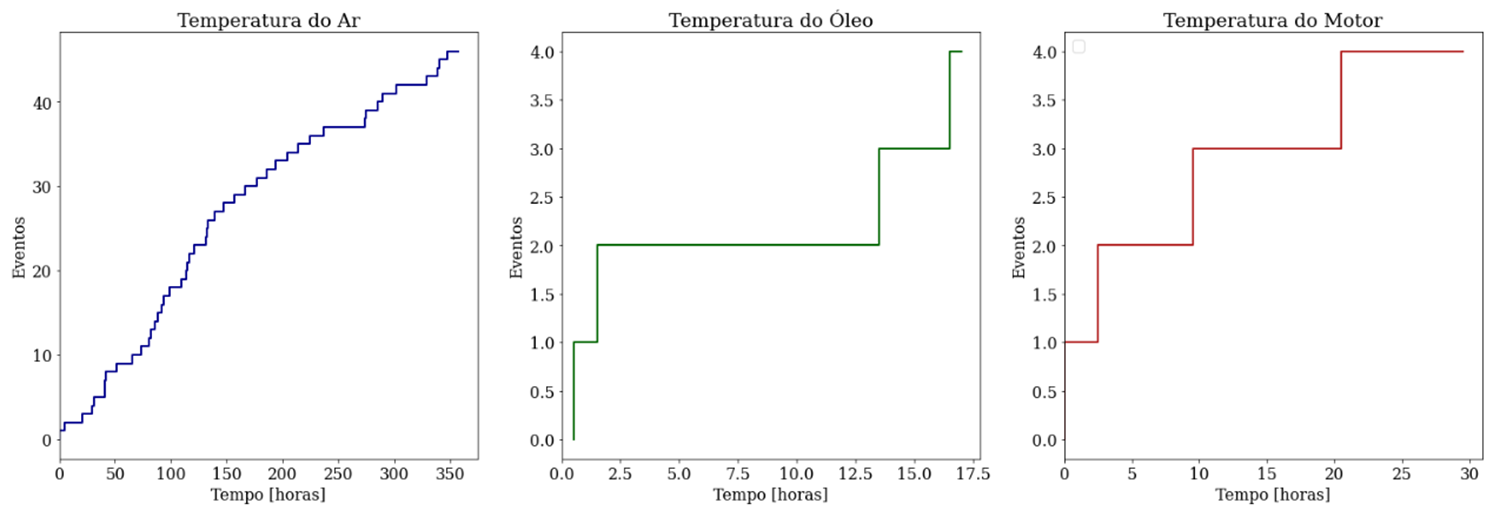
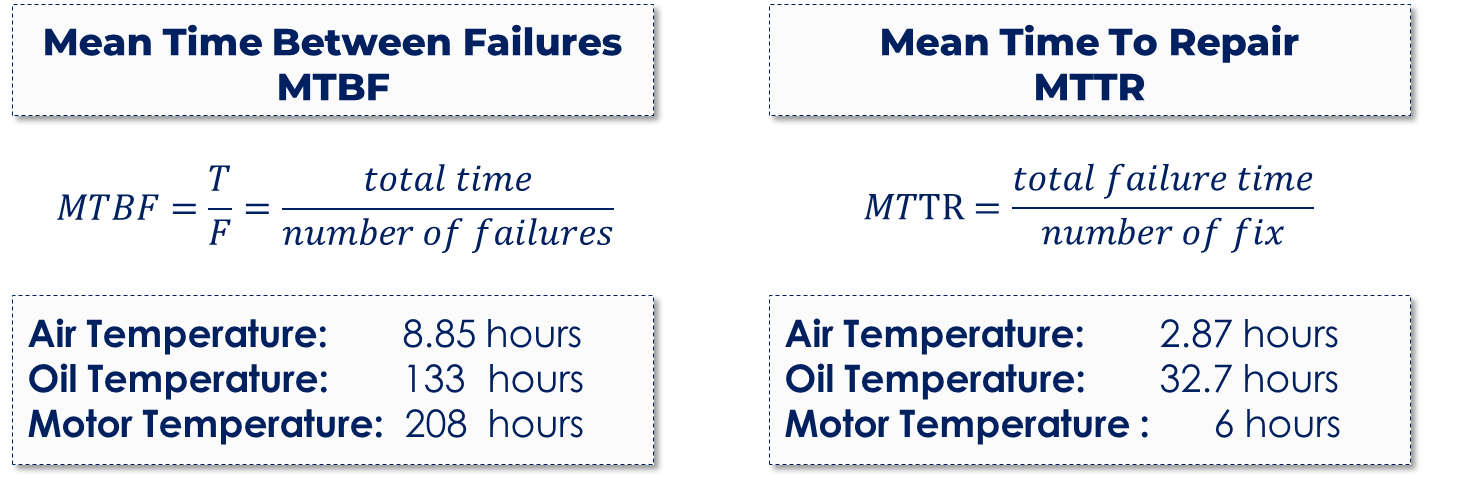
The above image with corresponding data enables to calculate the Mean Time Between Failures (MTBF) and the Mean Time To Repair (MTTR). The result from analysis per variable is shown below:
Finally, it was also calculated the Mean Cumulative Function (MCF) for the combination of parameters.
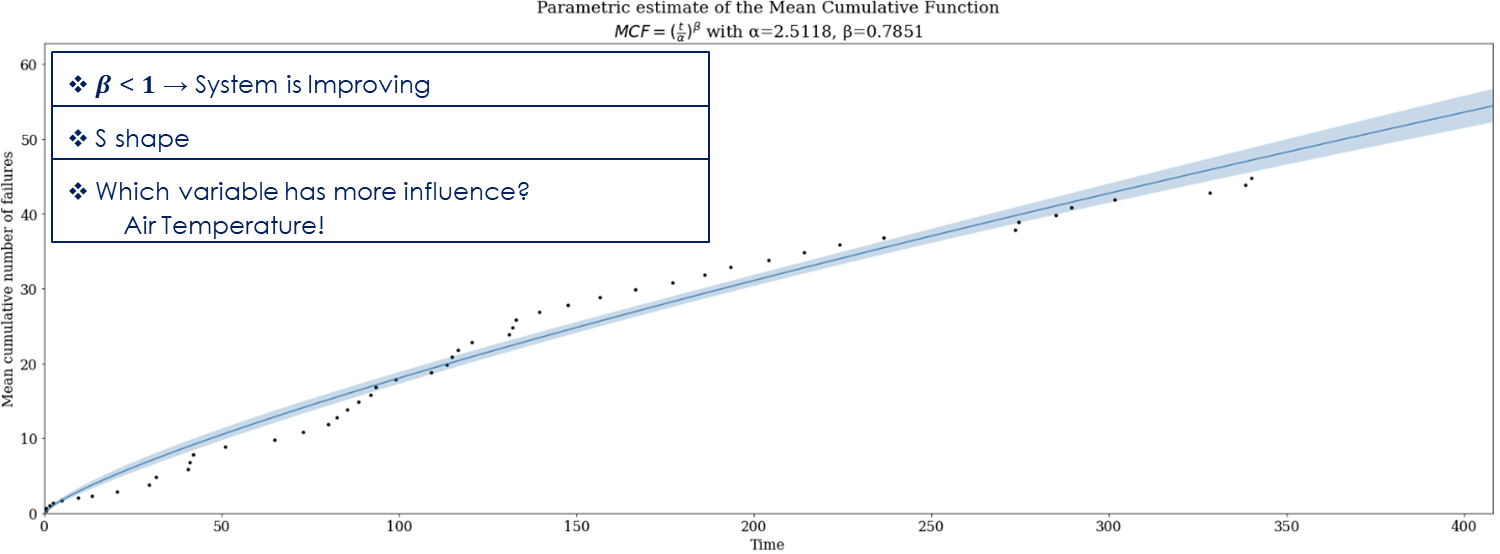
The combination of results from MTBF, MTTR and MCF allows the prediction of the probably time until the next failure.
A Dashboard was built using Plotly-Dash and is available in SENAI for near Real-Time monitoring of Air Compressor data.
For details reach out to: Peres, Nilson.
Detailed presentation can be found below, available in Portuguese (BR) only.
Análise-de-confiabilidade-compressores-de-ar_final_previa_novo_final_final_ultima_versao_v3.pptx