


DTInsight is a systematic and automated tool for producing continuous reporting for Digital Twins (DTs). It generates an interactive conceptual architecture visualization—called a DT constellation—from an ontological description of the DT, and integrates the output into a CI/CD-driven reporting page.

DTInsight is built around three pillars of DT reporting:
| Pillar | What it does |
|---|---|
| Explicit Reporting | Model the DT using the 21 characteristics of the DT Description Framework (DTDF) in the Ontology Modeling Language (OML), providing a systematic and consistent description. |
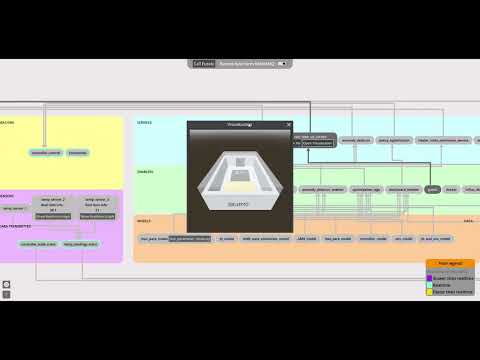
| Interactive Reporting | Explore a DT constellation: a conceptual architecture showing data flow between Physical Twin components (Sensors, System, Environment, Operator, Machine) and DT capability layers (Models/Data, Enablers, Services). Supports real-time sensor data and 3D visualization. |
| Continuous Reporting | Auto-generate an up-to-date reporting page (characteristics table, architecture screenshot, interactive web embed) from a CI/CD pipeline on every commit. |


DTInsight is built with the Godot Engine (v4.5, .NET/C#) and uses GDScript for the UI and visualization logic.
DTInsight/
├── MainScene/          # Main scene controller, CI/CD TCP server, settings
├── DTContainer/        # DT & PT constellation layout, link drawing, visual editing
├── GenericDisplay/     # Reusable DT component display, pop-up charts & scripts
├── Fuseki/             # SPARQL query catalogue, Fuseki server caller, data dump
├── RabbitMQ/           # RabbitMQ connection & real-time data handling (C#/.NET)
├── Camera/             # 2D camera controls (pan, zoom, keyboard)
├── Config/             # Global configuration (style, Fuseki, RabbitMQ, camera, etc.)
├── ControlPanel/       # Settings UI panel
├── Legends/            # Color legend for implementation status & timescale
├── Build/              # Pre-built exports (Linux, Web)
└── .github/workflows/  # GitHub Actions CI/CD for automated builds
Key integrations:
- Apache Jena Fuseki — serves the DTDF ontology as an RDF triple store; DTInsight queries it via SPARQL over HTTP.
- RabbitMQ — message broker for subscribing to real-time sensor data streams (via the .NET RabbitMQ client library).
- openCAESAR Rosetta — recommended IDE for editing the OML description model.
- GitHub Actions — CI/CD workflow that exports Linux and Web builds on every push to
develop.
Note: You can view tutorial slides at https://1drv.ms/p/c/86984f2cdf02822a/IQDsOu-5YYM6QKA_Xj-bf8tYAROfy-sjk1sZlwdcaXVK_aY?e=CK9JFc
- Godot Engine 4.5 (.NET / C# version) — download
- .NET 8 SDK — required for the RabbitMQ C# integration
- Apache Jena Fuseki — bundled via openCAESAR Rosetta, or standalone
- A DTDF-compatible OML ontology — see the DTDF repository
- (Optional) A running RabbitMQ instance publishing DT sensor data
- Clone the repository:
git clone https://github.com/oakeslabmtl/DTInsight.git
- Open the project in Godot Engine 4.5 (.NET version).
- Build the C# solution to restore the RabbitMQ.Client NuGet package:
dotnet restore
dotnet build
- Run the project from the Godot editor or export it for your platform.
Click the gear icon (bottom-left) to open the settings panel.
-
Open your OML ontology project in openCAESAR Rosetta.
-
In the Gradle Tasks tab, start the Fuseki server with the
startFusekitask and run theowlLoadtask to push the ontology data.
On Windows, you can also call these tasks with:
gradlew.bat startFusekiand then
gradlew.bat owlLoad -
In DTInsight, click the "Call Fuseki" button:

If a dump was previously exported, select the file with the file picker and click "Load".

After loading an ontology, enter a file path in the dump input box and click "Dump". The resulting file can also be inspected in a text editor to verify loaded data.
Once loaded, you see a top-down conceptual architecture of the DT, structured as:
- Left side (Physical Twin): Operator, Machine, System, System Environment, Sensors/Data Transmission
- Right side (Digital Twin): Models/Data → Enablers → Services
Directional arrows show inter-component dependencies and data flow.
| Action | QWERTY | AZERTY | Mouse |
|---|---|---|---|
| Move up | W | Z | Click + drag |
| Move down | S | S | Click + drag |
| Move left | A | Q | Click + drag |
| Move right | D | D | Click + drag |
| Zoom in | E | E | Scroll up |
| Zoom out | Q | A | Scroll down |
Hover over a component to highlight it and its connected components, revealing data-flow paths. Click to lock the highlight.

Enable Visual Editing mode from the control panel to:
- Add new components to any container via the
+buttons - Rename or edit descriptions by right-clicking a component
- Draw links by dragging from one component to another
- Delete links by enabling link deletion mode and clicking on a link
If your DT publishes sensor data via RabbitMQ and your ontology includes the necessary linking metadata:
- Toggle "Record data from RabbitMQ" in the settings.
- Real-time values will appear on the corresponding DT components.
- Click the pop-up button on a component to view a live chart of the last 100 messages (supports numerical and boolean values).

Note: If nothing appears after enabling real-time data, either the ontology is missing the RabbitMQ linking data or no messages are being published. Inspect a dump file to verify the data.
- Create a separate Godot project (same Godot version as DTInsight).
- Create a scene called
main.tscnwith a_on_message(message)function to receive real-time data. - Export the project as a
.pckfile. - Ensure the OML description includes
DTDFVocab:HasVisualization true. - In DTInsight, pick the
.pckfile to open the 3D visualization in a pop-up.

The visualization reflects incoming sensor data (e.g., updated temperature labels, heater color changes).
If the ontology contains relative file paths to DT source code:
-
Select the software folder from the settings panel.


-
Components with associated scripts will display a button with the script filename. Click to view.

DTInsight integrates into a CI/CD pipeline (currently GitHub Actions) to automatically produce an up-to-date reporting page on every commit. The pipeline:
- Loads the committed DTDF ontology into a Fuseki server.
- Runs DTInsight (headless, via Linux
xvfb) and triggers the internal TCP CI/CD server (port9090). - Outputs:
- HTML characteristics table — summary of the 21 DTDF characteristics
- Architecture screenshot — high-resolution tiled capture of the DT constellation
- YAML architecture dump — machine-readable description of the constellation
- Deploys the reporting page as a static website (via Hugo).
An example reporting page for the incubator DT is available at: oakeslabmtl.github.io/DTDF
- Model your DT in the DTDF using OML/OWL/RDF.
- Configure the static website deployment (e.g., Hugo + GitHub Pages).
- Set up the CI/CD workflow to load the ontology, run DTInsight, and deploy.
- DTDF Ontology & Example DT: oakeslabmtl/DTDF
- openCAESAR Rosetta: opencaesar/oml-rosetta
- Example DT (Incubator): INTO-CPS-Association/example_digital-twin_incubator
If you use DTInsight in your research, please cite our paper. An open-access preprint is available on arXiv.
@INPROCEEDINGS{fiter2025dtinsight,
    author={Fiter, Kérian and Malassigné-Onfroy, Louis and Oakes, Bentley},
    booktitle={2025 ACM/IEEE 28th International Conference on Model Driven Engineering Languages and Systems Companion (MODELS-C)},
    title={DTInsight: A Tool for Explicit, Interactive, and Continuous Digital Twin Reporting},
    year={2025},
    volume={},
    number={},
    pages={139-143},
    keywords={Visualization;Three-dimensional displays;Systematics;Data visualization;Ontologies;Real-time systems;Software;Digital twins;Stakeholders;Monitoring;digital twins;software visualization;software documentation;decision-making;ontologies;OML;monitoring},
    doi={10.1109/MODELS-C68889.2025.00030}
}- Kérian Fiter (@KerianFiter)
- Louis Malassigné-Onfroy (@Ryskann)
- Under the supervision of Prof. Bentley Oakes
This project is licensed under the Creative Commons Attribution-NonCommercial-ShareAlike 4.0 International License.