
In this self paced collection of Repositories, you will find many projects related to Supervised Learning, Unsupervised Learning, Recommender Systems and Deep Learning that I have worked on so far. Throughout this guideline you will walk through the details of projects and repositories.
You may reach me whenever you want to get further information about projects.
Projects on AIRFLOW coming soon....
| Problem | Methods | Libs | Repo |
|---|---|---|---|
| Service Request Management using NLP | NLP,Text Processing,TF-IDF,Deep Learning |
Scikit Learn,Keras |
Click |
| Adult Income Prediction Project | One Hot Encoding,Label encoding,Target Mean encoding,K-fold |
Scikit Learn,Keras |
Click |
| How to arrange a ML Project | K Fold Cross validation, Tuning, |
Scikit Learn |
Click |
| Google Street View Images Recognition | Deep Learning, ANN, Image Recognition ,Hyper-Param Tuning |
Google Street view Dataset,Keras, Talos , Scikit Learn |
Click |
| Real Time Analytics using SPARK | Spark Streaming, Twitter, Real Time Analytics |
StreamListener, Spark |
Click |
| Model Interpretability | Interpretation, Deep Learning, pipeline |
SHAP, ELI5, LIME, XGB, Random Forests |
Click |
| Tensorflow Keras Model Deployment | Deployment, Deep Learning |
Keras, Flask, PIL, base64 |
Click |
| Telecom Churn Classification using Spark | Classification, GBTClassifier, RandomForestClassifier, DecisionTreeClassifier |
pyspark, koalas, mllib |
Click |
| Fashion MNIST Classification | Classification, DeepLearning, ANN |
Keras, plotly |
Click |
| Bank Customer Churn Modelling using Neural Networks | Classification, DeepLearning, ANN, Statistical Tests |
Keras, AutoViz, plotly, pandas, seaborn, TALOS |
Click |
| HR Analytics and classification using ANN | Classification, DeepLearning, ANN |
Keras, AutoViz, plotly, pandas, seaborn,StratifiedKFold |
Click |
| ML Model Deployment | Deployment |
pickle, flask, ensemble, pandas |
Click |
| Clustering cars based on attributes | UnSupervised learning |
plotly, AgglomerativeClustering, K-Means, Dendograms, silhouette |
Click |
Please, scroll down to see the details of projects comprehensively and visit their repository.

The average time between service request submission and fulfillment is 32 days. That’s why 1 in 5 service requests fail.
When it comes to fulfilling your service requests, how would you rate your IT department? Any time you submit a formal request for information technology -a new computer, access to an online portal or another service, a new version of a software program or information on how to use it- your IT department should have the ability to plan for these requests, even automate the fulfillment workflow, and give you a positive service experience.
This problem can be addressed using NLP and automate the toughtest job at hand, To send requests to correct team.
The notebook has a deepdive of the implementation and EDA and checking various options, however, DeepLearning works best with NLP. Notebook is here Click
The top classification accuracy is 98.7% with deep learning, without Tuning the networks !!!
Full project setup is in progress!!
The main idea behind this project is to understand different ways to treat categorical variables and use them in classification setting. repo is here Click
Jupyter notebooks are great! but they wont help you if you want to run things fast or in parallel or in a LINUX env.
In Industry projects in general follow the below example.

This project shows an simple classification example of Predicting if a person has diabetes or not.
Repo link : Click
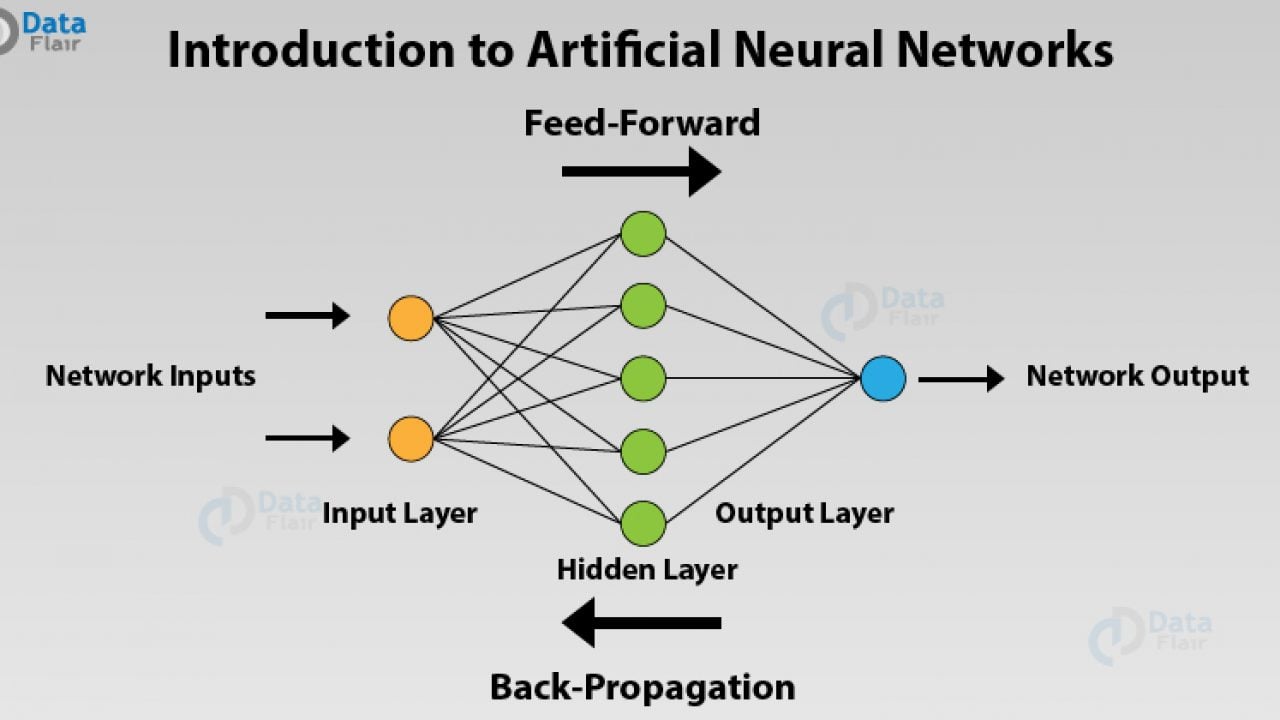
Object recognition and image processing has become one of the hottest topics in machine learning due to its vast and creative potential applications in the real world. The ability to process visual information using machine learning algorithms can be very useful, such as measuring the quality of NYC Bike Lanes through street imagery. Within this field, Within this field, the Street View House Numbers (SVHN) dataset is one of the most popular ones. It has been used in neural networks created by Google to read house numbers and match them to their geolocations. This is a great benchmark dataset to play with, learn and train models that accurately identify street numbers, and incorporate into all sorts of projects.

In this project we try to predict the numbers from Images and this is achived by using ANN model built in KERAS
Repo link : Click
Real Time Analytics is a growing feild where data would be streaming continously and analysis would be done on the data.
Using the above code, and by changing the keywords we can analyse any of the recent trends from Twitter related to the keyword that we have.
Machine learning is in the center of the latest progress in technology and is an essential tool for accurate predictions nowadays. However, most of the time we neither can clearly identify nor explain the logic behind these predictions because the model is just too complex. In those cases our machine learning model is called a ’Black Box’.
So how do we know if we can trust this model? How should we be able to trust it, when we don’t even know how it actually makes it’s predictions?
These are important questions which occur when the challenges of Model explainability are presented, especially if it is used for decision making. Users need to be confident that the model will perform well. Gaining trust in predictions through increasing transparency of a black box model.
There are multiple python libraries for this task.
- ELI5
- LIME
- SHAP
Practical classification task with mutliple blackbox models and their interpretations are in the Repo
More details are here
Often there’s a need to abstract away your machine learning model details and just deploy or integrate it with easy to use API endpoints. For eg., We can provide a URL endpoint using which anyone can make a POST request and they would get a JSON response of what the model has inferred without having to worry about its technicalities.
In this project, we will create a Flask server to deploy our MSIST classification artificial neural network (ANN) built in Keras. We will then create a simple Flask server which will accept POST request and do some image preprocessing and return the predictions.
Server code is Here
Model building and saving is Here
For the data input of image we are using CSS here but we can use any technology as long as we call the API on our server in specifed path and required format.
CSS source code is Here
After the server is launced and we can go to specified url, in this case as we are doing local deployment the URL would be "http://127.0.0.1:8111/"

The screen on that url would look like this:

We just need to write any number in the white box and click on predict button and we would see the result.

Customer Churn is a bigger problem for most of the companies. If we can identify the potential customers who could be leaving the company, we can take precautionary measures and retain the customers. This project deals with Telecom data and uses pyspark which helps in working with larger datasets in organizations with massive data.
Spark, is a framework based on Hadoop technologies that provide far more flexibility and usability than traditional Hadoop. It is probably the best tool for managing and analyzing large datasets, aka Big Data.
The Spark ML framework allows developers to use Spark for data processing at scale while building machine learning models.
Here is a notebook to predict churn from telecom data
I have used many concepts like
- Koalas
- Preprocessing in Spark
- Data Visualisation
- Building pipelines and generating Feature importances
- Compare different models
- Insights learned from the whole process


Simply put, customer churn occurs when customers or subscribers stop doing business with a company or service. Also known as customer attrition, customer churn is a critical metric because it is much less expensive to retain existing customers than it is to acquire new customers – earning business from new customers means working leads all the way through the sales funnel, utilizing your marketing and sales resources throughout the process. Customer retention, on the other hand, is generally more cost-effective as you’ve already earned the trust and loyalty of existing customers.
Customer churn impedes growth, so companies should have a defined method for calculating customer churn in a given period of time. By being aware of and monitoring churn rate, organizations are equipped to determine their customer retention success rates and identify strategies for improvement.
Neural Networks, Classification, Keras, Tensorflow
Analyzed cars dataset and performed exploratory data analysis and then categorized them using K means clustering. Used linear regression on the different clusters and estimated coefficients.
K means clustering, Hierarchical clustering, EDA, Linear Regression