A loose collection of modules which can read mass spectral data (EI-MS or MS/MS), produce a ranked list of formula annotations using the parent subformula graph (PSG) method, and then for every (possible) mass peak in the mass spectrum, visualise the annotated mass spectrum as a 2 dimensional fragment plot.
If you use these modules in your work, please cite: Li, S., Bohman, B., Flematti, G.R. et al. Determining the parent and associated fragment formulae in mass spectrometry via the parent subformula graph. J Cheminform 15, 104 (2023). https://doi.org/10.1186/s13321-023-00776-y
1, Install Conda (see https://docs.conda.io/projects/conda/en/latest/user-guide/install/index.html).
2, Append conda-forge to the channel with the command
conda config --append channels conda-forge3, Download the code in this repository and navigate to the 'subformula-graphs' directory.
4, Create a new conda environment with the required packages using the command
conda create --name [YOUR_ENV_NAME] --file requirements.txtAlternatively, manually installing the required dependencies in the modules with another package manager such as pip would also work (however note that pip cannot read the requirements.txt!).
Here are some examples of how the modules can be used:
>>> import spectrum_reader
>>> reader = spectrum_reader.read_ms_from_file("tests/massbank_spectra_negative.txt")
>>> reader.read_metadata()
{'File Format': 'MassBank Data File', 'Compound Name': '2,4-Dinitrophenol', 'SMILES': 'OC1=C(C=C(C=C1)[N+]([O-])=O)[N+]([O-])=O', 'Ion Mode': 'ION_MODENEGATIVE', 'Molecular Mass': 184.01202, 'Molecular Formula': 'C6H4N2O5', 'Instrument Type': 'LC-ESI-QFT'}
>>> reader.read_mass_spectrum()
{80.02457645207001: 56423.6, 96.01977645207: 544152.1, 98.03537645207: 40399.2, 110.02317645207: 331489.9, 124.01557645207001: 1709976.1, 126.01867645207: 84719.3, 138.01907645207: 494922.3, 154.01407645207001: 1736880.5, 184.01207645207: 12003717.0}
The spectrum_reader module can read mass spectra from a variety of file formats (currently accepted ones include .CDF, .jdx, and .csv) and return a dictionary of {mass: intensity} values. Note that in the current version of this program .txt files are assumed to be MassBank records. If ion mode information is present in the metadata, the masses in the mass spectra data will be neutralised (i.e electron/proton masses will be added/subtracted) before it is parsed into the dictionary.
If you prefer to parse the mass spectral data and perform corrections on it yourself, you can directly use the mass_spectrum module to perform the analyses by instantiating a MassSpectrum object with a {mass: intensity} dictionary and a ppm error:
>>> from mass_spectrum import MassSpectrum
>>> spec_dict = {80.02457645207001: 56423.6, 96.01977645207: 544152.1, 98.03537645207: 40399.2, 110.02317645207: 331489.9, 124.01557645207001: 1709976.1, 126.01867645207: 84719.3, 138.01907645207: 494922.3, 154.01407645207001: 1736880.5, 184.01207645207: 12003717.0}
>>> ppm_error = 5
>>> ms = MassSpectrum(spec_dict, ppm_error)
>>> allowed_elements = ["C","H","N","O"]
>>> annotations = ms.get_spectral_annotations(allowed_elements, ms.product_scoring_function)
>>> annotations
[[C6H4O3, C5H4NO3, C6H4NO3, C6H4NO4, C6H4N2O5], [C7N6O]]
>>> ms.get_formula_dict(annotations[0])
{'C6H4O3': 1709976.1, 'C5H4NO3': 84719.3, 'C6H4NO3': 494922.3, 'C6H4NO4': 1736880.5, 'C6H4N2O5': 12003717.0}
Here, "ppm_error" refers to the standard deviation of the measurement error in the mass spectrum. The get_spectral_annotations() method returns a ranked list of possible annotations (a list of lists). Each molecular formula in a given annotation corresponds to a mass present in the mass spectrum. The number of possible annotations correspond to the number of molecular formulae with a mass deviation (in ppm) within 3 standard deviations of the parent mass (largest mass in the mass spectrum). Fragment formulae are annotated with a formula within delta_frag * standard deviation of the corresponding mass possessing the least mass deviation. If no such formula exists, the mass is ignored. The get_formula_dict() method returns an annotated mass spectrum; i.e a dictionary of molecular formulae and intensities corresponding to the intensity of the mass peak that the formula annotates. Masses which cannot be annotated is ignored.
We can also scan through all possible masses within some lower/upper bound, rather than simply assume the largest mass is the molecular ion. This is useful in the case of EI-MS, where one is unsure about the identity of the molecular ion; it may possess a very low intensity and be obscured by interfering masses.
...
>>> lower_bound = 100
>>> upper_bound = 200
>>> annotations = ms.compute_most_likely_molecular_ion(allowed_elements, ms.product_scoring_function, lower_bound, upper_bound)
>>> annotations
[[C3H2N3, C3H2N3O, C3H2N4O, C4H2N3O2, C3H2N4O2, C4H2N4O2, C4H2N4O3], [C5H4O2, C5H4NO2, C6H4O3, C5H4NO3, C6H4NO3, C6H4NO4, C6H4N2O5], [C3H2N3, C3H2N3O, C3H2N4O, C4H2N3O2, C3H2N4O2, C4H2N4O2], [C3H2N3, C3H2N3O, C3H2N4O, C3H2N4O2], [C3H2N3, C3H2N3O, C3H2N4O], [C5H4O2, C6H4O3], [CN6, C7N5, C7N6O]]
This time, the correct annotation is ranked second in the list of possible annotations, because a fragment ion is assigned an incorrect formula, treated by the program like the molecular ion, and the resulting set of annotations yielded a spuriously high score. In cases like these, we can inspect a plot of the whole-spectrum annotation, by using the visualisation module.
...
>>> from visualisation import MSVisualiser
>>> import matplotlib.pyplot as plt
>>> vis = MSVisualiser(ms, annotations[0])
>>> vis.plot_ms_as_2D_fragment()
>>> plt.show()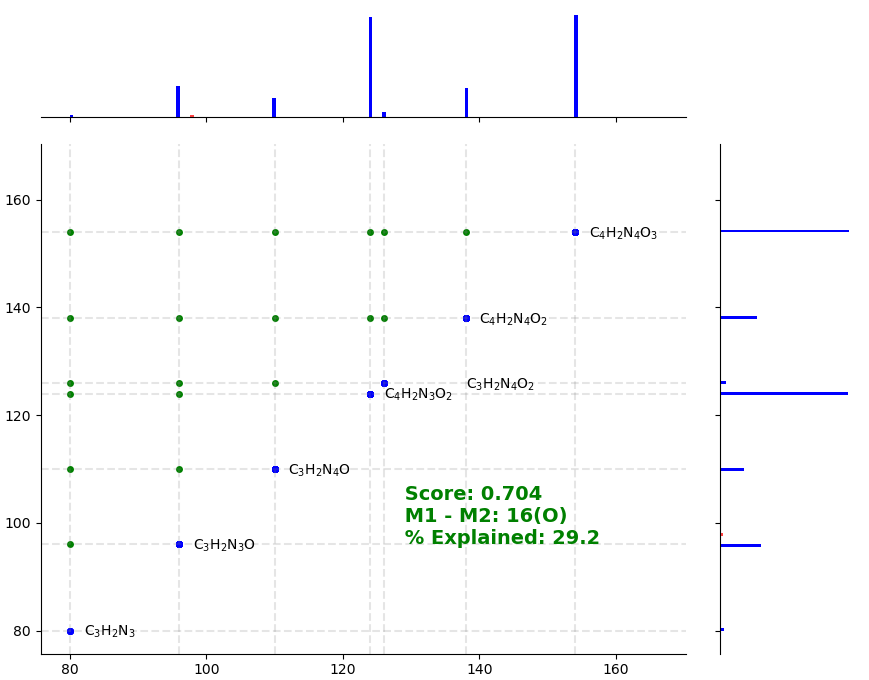
The mass spectrum is plotted on both the x and the y axes (truncated past the mass of the parent formula in the annotation). Blue mass peaks correspond to those which are annotated with a molecular formula, and red mass peaks correspond to those which cannot be annotated with any formulae. A green dot is included if the formulae which annotates two mass peaks possess a formula-subformula relationship. In the above plot, we can see that only 29.2% of the spectrum is explained (i.e only 29.2% of the total ion current received by the detector corresponds to mass peaks which are annotated by formulae). This suggests that either the mass spectrum is very low quality, the estimate of the ppm error of the instrument is too low, or the formula annotation is wrong. In this case, the last possibility is correct.
Indeed, we can plot the correct annotation instead
...
>>> vis = MSVisualiser(ms, annotations[1])
>>> vis.plot_ms_as_2D_fragment()
>>> plt.show()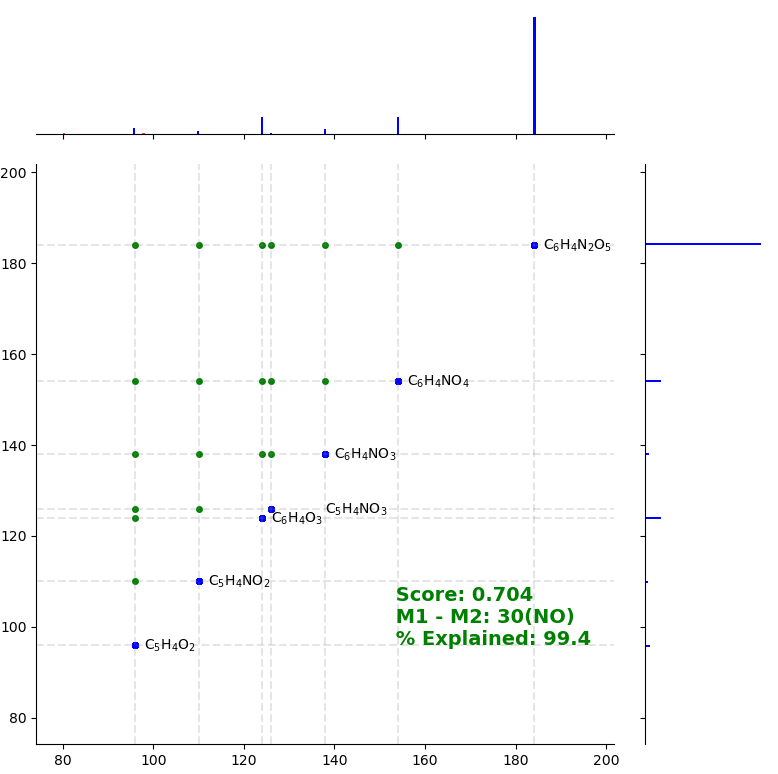
We see that this time, 99.4% of the spectrum is explained. This constitutes a much better explanation (formula annotation) for the entire mass spectrum.